
- Entering text into the form field will trigger a list of options
Trending Searches
- Invest / Login
Beyond the GDP Print: High-Frequency Indicators point to a Broad-Based Economic Growth!

Last Updated On: 3 Sep 2026
5 min read
What’s the Point?
- High-Frequency Indicators for July and August 2026 continue to indicate resilience in the Indian economy, at a time when the International Monetary Fund (IMF) has projected global growth of 3.0% for the year while placing India among the fastest-growing major economies. The data on Q1FY27 Real GDP growth of 7.8% (MoSPI*), ahead of the RBI’s 7.0% projection for the quarter, confirms this assessment.
- The strength is broad-based: E-way bill generation reached a near-record 139.79 million, 2-wheeler and tractor registrations grew in double-digits and bank credit grew by 19.3% YoY. Gross Fixed Capital Formation grew by 11.9% YoY in Q1FY26 against 5.8% a year earlier. High frequency indicators related to capex also confirm this trend. For example, IIP capital goods YoY growth has averaged 14.3% in the last 9 months.
- India’s macroeconomic resilience, despite geopolitical tensions that continue to strain global growth through supply chain disruptions and elevated crude oil & other commodity prices, could be a significant positive.
In its World Economic Outlook Update of July 08, 2026, the IMF projected global growth of 3.0% for the year, against an average of 3.5% over 2024 and 2025, with the West Asia war weighing on energy importers. Brent crude rose 63.3% to a peak of US$118.35 per barrel (/bbl) between February 27, 2026 and March 31, 2026, then fell 39.5% to US$71.57/bbl by July 01, 2026 after the US and Iran signed a Memorandum of Understanding to end the war, before renewed tensions lifted it 40.7% to US$100.69/bbl by July 23, 2026. US growth eased to 1.5% in the June quarter and China's manufacturing sector returned to contraction.
Amidst this uncertainty, India has been largely insulated, supported by domestic demand. The 2025 Income Tax reductions and GST rate rationalisation lifted disposable incomes, while 125 bps of rate cuts between February and December 2025 eased financial conditions. With July 2026 CPI inflation at 4.45%, close to the RBI’s 4% target, the Repo Rate has since been held at 5.25%. Forex reserves reached a record US$729.3 billion in the week ended August 21, surpassing February 2026's US$728.5 billion, and Foreign Portfolio Investors (FPIs) invested ₹51,119 crore in Indian equities in July and August 2026, after 4 months of selling. Not every indicator has moved in step, with demandside indicators growing steadily while production-side indicators moderating from a high base.
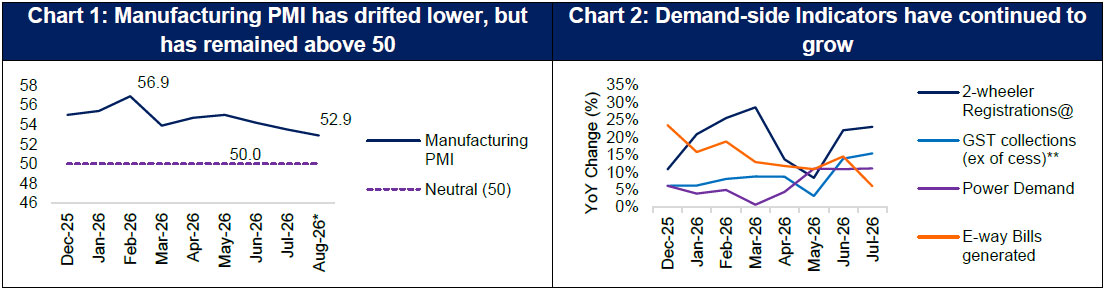
Source: HSBC / S&P Global India Manufacturing PMI, www.gstn.org.in , CMIE, PIB, RBI, www.vaahan.parivahan.gov.in ; PMI Data Period: December 2025 to July 2026. Number >50 reflects expansions and number <50 reflects contraction compared to previous month. *Flash estimate. **GST collections for the month is for economic activity in the previous month. @Figures are preliminary data and are subject to revision.
Demand-side Indicators remain firm
E-way bill generation rose 5.98% YoY to a near-record 139.79 million in July 2026, while petrol and diesel sales grew 9.7% and 10.7%. Two-wheeler registrations grew 22.0% in June and 23.0% in July, tractor sales are near 20%, and bank credit grew 19.3% YoY as of July 2026 against 15.4% YoY deposit growth. The August 2026 Monetary Policy Committee (MPC) resolution attributed growth to resilient domestic demand, sustained expansion in manufacturing and services, and robust exports.
Production-side Indicators have moderated
The Manufacturing PMI moderated to 52.9 in August 2026, from 53.5 in July 2026 and 56.9 in February 2026, a third consecutive monthly decline and the weakest reading since August 2021. Any level above 50 indicates expansion, so the index continues to signal growth, albeit at a slower pace, with the Manufacturing Output Index at 54.9 against 56.4 in July 2026.
The sub-indices of PMI indicate that output and new orders grew at their slowest pace in 5 years, which the survey attributes to challenging market conditions, competitive pressures and softer customer demand. Employment – weighted at 20% of the headline index – fell for the first time in 2.5 years; as hiring decisions typically lag demand, this is the most forward-looking sub-index. The weakness is confined to manufacturing, with services hiring rising to a 15-month high over the same period.
Input cost inflation eased to a 7-month low, even as firms raised selling prices at the fastest rate since April 2026 to pass on earlier increases. In Q1FY27 (see our TTP of August 25, 2026: Q1 FY27 Earnings: Profit Growth Broadens as Banks and Small Caps Lead), aggregate EBITDA margin for non-financial sectors contracted 2.75 percentage points YoY to 17.5%, as raw material costs rose from 51% to 56% of sales. Despite weakening profitability, the capital goods and automobile sectors sustained their execution and sales volumes. Hence, the easing price inflation could support margins in the upcoming quarters.
Conclusion
The Indian economy has remained resilient through a period of elevated crude prices and a weaker global growth environment. Demand-side indicators have continued to grow, while the moderation on the production side has been from a high base. The translation of festive demand into factory orders warrants close attention.
This resilience is especially visible in the Q1FY27 national accounts released by MoSPI on August 31, 2026, with Real GDP growing 7.8%, against 6.9% a year earlier and the RBI’s 7.0% projection for the quarter. Gross Fixed Capital Formation rose 11.9%, against 5.8% a year earlier, and merchandise exports grew 16.1% YoY, against 1.4%, even as world trade slowed. The RBI had cited these same factors, along with easing supply-side disruptions, when it raised its FY27 growth projection to 6.7% at the August 2026 MPC. With easing input cost inflation and forex reserves at a record, the backdrop entering the festive season is more supportive than it was 3 months ago.
Sources: PMI by S&P Global, www.gstn.org.in , CMIE, RBI, www.vaahan.parivahan.gov.in , PIB, *Ministry of Statistics and Programme Implementation, and other publicly available information.
About Tuesday’s Talking Point (TTP): TTP is an effort by HDFC AMC to guide key conversations in the Indian financial markets and investing ecosystem. We aspire to do this by providing relevant facts, along with our perspective on the issue at hand. Please provide your feedback at this link: https://forms.office.com/r/Cr8JNjMGWk
Disclaimer: Views expressed herein are based on information available in publicly accessible media, involve known and unknown risks and uncertainties that could cause actual results, performance, or events to differ materially from those expressed or implied herein. The information herein is for general purposes only. Stocks/Sectors/Views referred are illustrative and should not be construed as an investment advice or a research report or a recommendation by HDFC Mutual Fund (“the Fund”) / HDFC Asset Management Company Limited (HDFC AMC) to buy or sell the stock or any other security. HDFC AMC is not indicating or guaranteeing returns on any investments. Past performance may or may not be sustained in the future and is not a guarantee of any future returns. The recipient(s), before taking any decision, should make their own investigation and seek appropriate professional advice.
MUTUAL FUND INVESTMENTS ARE SUBJECT TO MARKET RISKS, READ ALL SCHEME RELATED DOCUMENTS CAREFULLY.
Stay ahead with our insights
Did you find this interesting?
Your opinion matters - share your thoughts and help us improve.