- Entering text into the form field will trigger a list of options
Trending Searches
- Invest / Login

PASSIVE HYBRIDS ARE HERE One Scheme with Dual Benefits of Equity and Debt
Last Updated On: 2 Nov 2026
|Created On: 2 Nov 2026


Key Highlights:
- While the Nifty Realty Index has undergone a time and price correction since mid-CY2024, fundamentals have stayed resilient over this period.
- Residential sales and premium housing demand have remained strong, while office vacancies across major cities have fallen to multi-year lows.
- The Nifty Realty Index’s P/B ratio has declined to slightly below its 5-year average, potentially offering a more favourable entry point for longterm investors.
At the heart of every portfolio lies two building blocks– equity, which provides growth potential, and debt, which helps provide portfolio stability. Over time, each has played a distinct role in shaping investment outcomes. Between CY2011 and CY2025, the Nifty LargeMidcap 250 TRI (equity) delivered an average
calendar year return of 15.5%, but with years of relatively large gains as well as falls. The Nifty 8-13 yr G-Sec Index (debt) delivered a lower average return of 7.5%, but within a much narrower range.
Since equity and debt have historically had a low correlation with each other, an allocation to both can help reduce portfolio volatility, thereby providing diversification benefits. The question for many investors, therefore, is not which of the two to choose, but how best to invest in both. Accordingly, we examine what benefits an Equity–Debt combination can offer and how investors can take exposure to a 70% Equity–30% Debt combination through a single index fund.
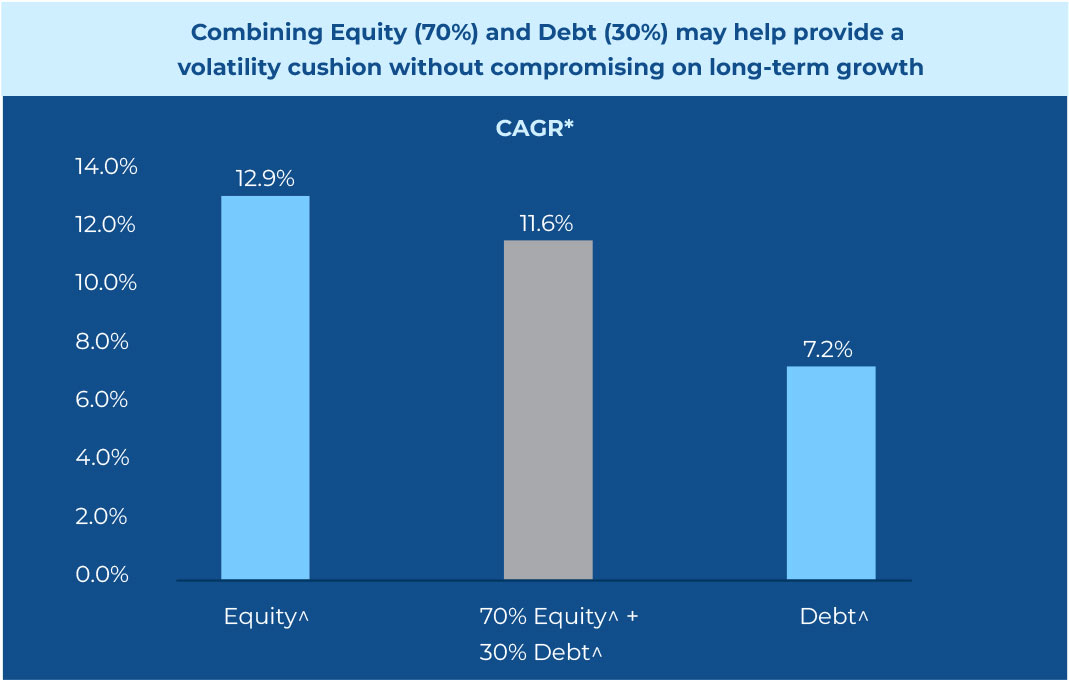

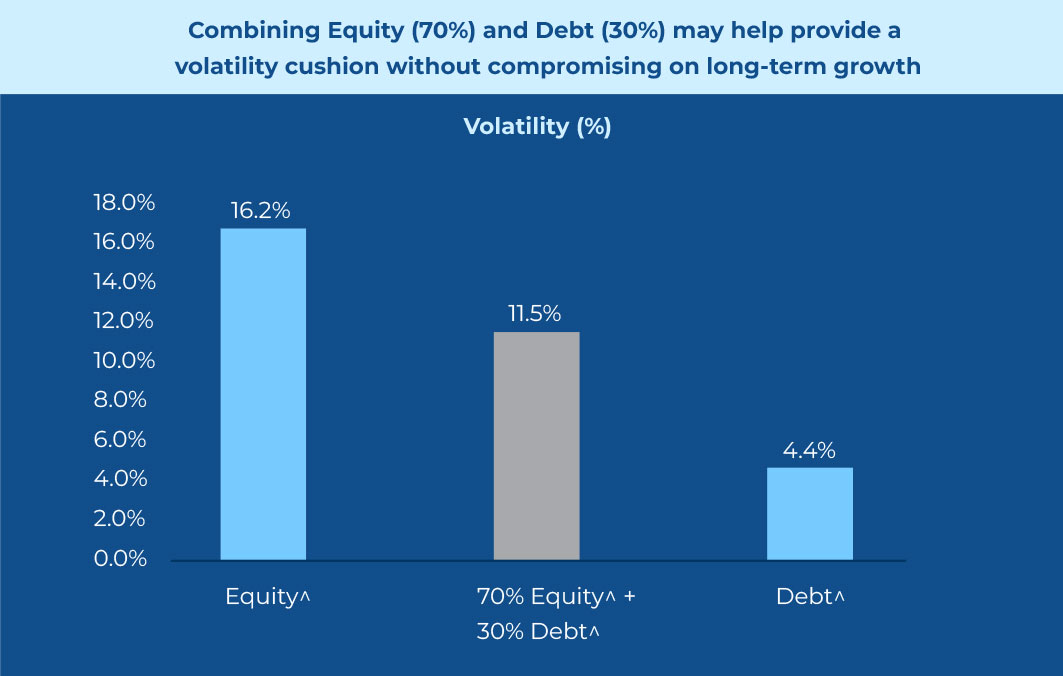
Source: NSE Indices Ltd. and internal calculations. Data from Jan 03, 2011 to Sep 30, 2026. Monthly rebalancing of various portfolio combinations is considered for the aboveanalysis. HDFC AMC/ Mutual Fund is not guaranteeing future returns of these asset classes. The above combinations are for illustrative purpose. Investors are requested to take professional advice while making investment decisions. ^The Nifty LargeMidcap 250 Index has been used as a proxy for Equity and the Nifty 8-13 yr G-sec Index has been used as a proxy for Debt. Past performance may or may not be sustained in the future and is not a guarantee of any future returns. HDFC AMC/Mutual Fund is not guaranteeing or promising or forecasting any returns. *CAGR: Compounded Annual Growth Rate
This 70% Equity–30% Debt combination has historically captured a large share of equity’s return with considerably lower volatility. Since Jan 2011, the 70:30 combination delivered a CAGR of 11.6% – about 90% of the 12.9% CAGR delivered by pure equity – with volatility of 11.5%, with just 71% of equity’s volatility of 16.2%. Thus, combining equity with debt may help achieve equitylike returns but with reduced volatility.
Note the historical examples above are not exhaustive and are for illustration purposes.
Why does the cushion provided by combining bonds with equities matter?
The benefit of holding a blend of bonds and equities is most visible when equity markets come under stress. During such periods, the hybrid index has historically fallen less than its pure equity counter -part. The volatility cushion provided by bonds in these scenarios is valuable to investors since the smaller the fall in portfolio value, the smaller the gain needed just to get back to the previous peak.
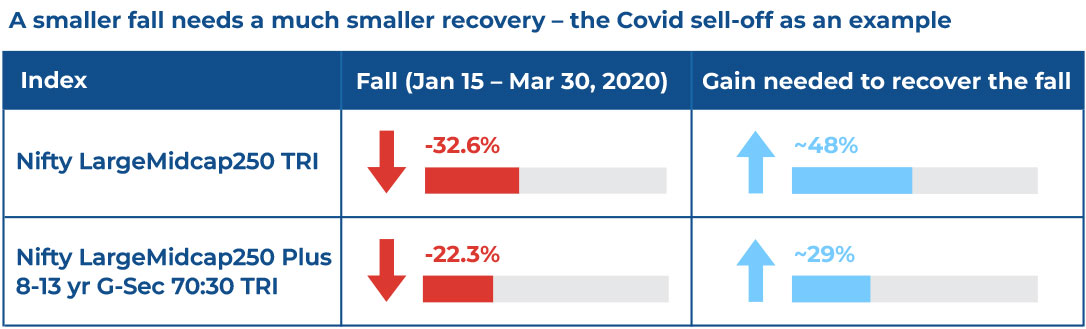
Source: NSE Indices Ltd. and internal calculations. Gain needed to recover = [1/(1 – fall)] – 1. The example is for illustration purposes and is not exhaustive. Past performance may or may not be sustained in the future and is not a guarantee of any future returns.
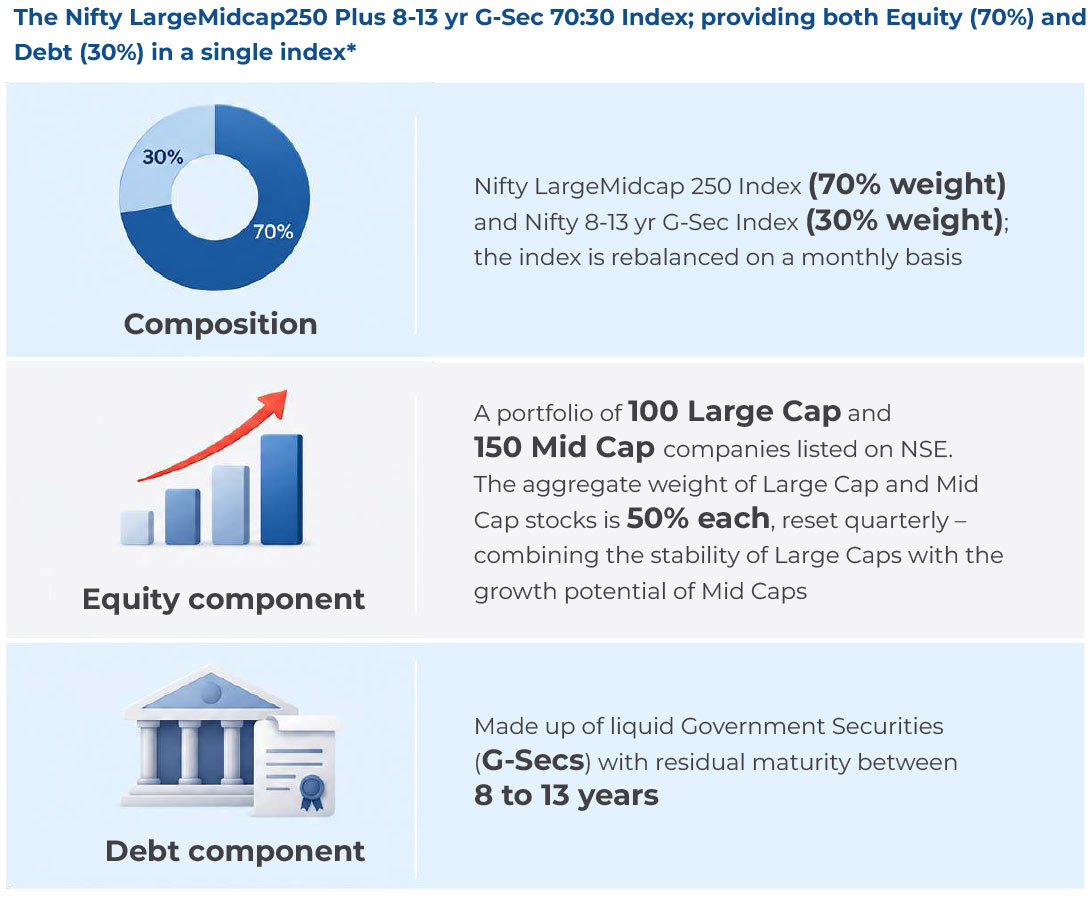
Source: NSE Indices Ltd. *For detailed methodology, please visit www.niftyindices.com
| Top 10 Equity constituents | Weight (%) | Debt constituents | Weight (%) |
|---|---|---|---|
| HDFC BANK LTD.£ | 2.95% | 6.94% GS 2036 | 17.05% |
| ICICI BANK LTD. | 2.57% | 6.48% GS 2035 | 7.41% |
| RELIANCE INDUSTRIES LTD. | 2.16% | 7.18% GS 2037 | 5.54% |
| BHARTI AIRTEL LTD. | 1.45% | Total of Debt constituents | 30.00% |
| LARSEN & TOUBRO LTD. | 1.20% | ||
| STATE BANK OF INDIA | 1.08% | ||
| AXIS BANK LTD. | 0.96% | ||
| INFOSYS LTD. | 0.95% | ||
| KOTAK MAHINDRA BANK LTD. | 0.83% | ||
| MULTI COMMODITY EXCHANGE OF INDIA LTD. | 0.72% | ||
| Total of Top 10 Equity constituents | 14.87% |
Source: NSE Indices Ltd. and internal calculations. As on Sep 30, 2026. Weights are of the constituents in the Nifty LargeMidcap250 Plus 8-13 yr G-Sec 70:30 Index. £Sponsor of HDFC Mutual Fund.
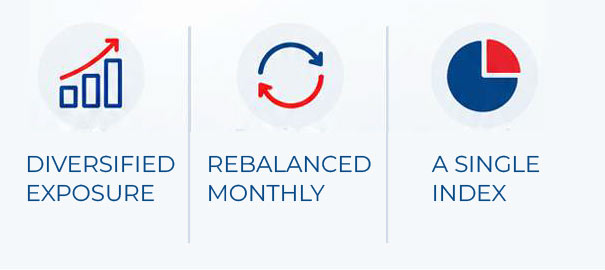
A single index thus provides investors diversified exposure across Large Cap and Mid Cap stocks, along with the most liquid Government of India bonds in the 8-13 year maturity segment.
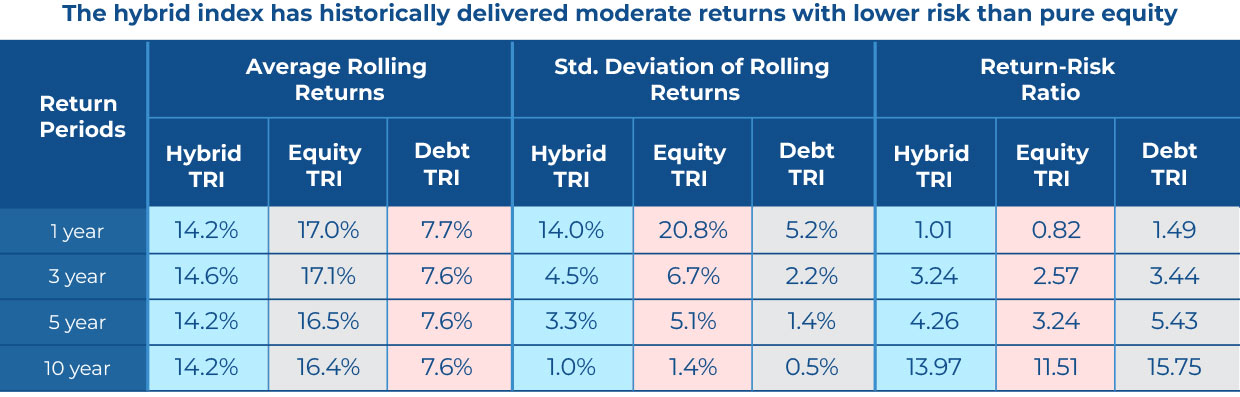
Source: Source: NSE Indices Ltd. and internal calculations. Based on daily rolling returns of Nifty LargeMidcap250 Plus 8-13 yr G-Sec 70:30 TRI (Hybrid Index), Nifty LargeMidcap250 TRI (Equity Index) and Nifty 8-13 yr G-Sec TRI (Debt Index). Return Period: Jan 03, 2011 to Sep 30, 2026 for the abovementioned indices, since Nifty LargeMidcap250 Plus 8-13 yr G-Sec 70:30 Index and Nifty 8-13 yr G-Sec Index has TRI values from Jan 03, 2011 onwards. Return Risk Ratio = Average Rolling Returns/ Std. Deviation of Rolling Returns. Past performance may or may not be sustained in the future and is not a guarantee of any future returns. HDFC AMC/Mutual Fund is not guaranteeing or promising or forecasting any returns.

Across periods, the hybrid index has delivered returns between those of its pure equity and pure debt components. Its average rolling returns and the standard deviation of those returns have historically been lower than pure equity but greater than pure debt, while its return-risk ratio has been higher than pure equity across 1, 3, 5 and 10-year horizons – indicating that an Equity–Debt combination may help improve the risk-adjusted returns of a portfolio.
Why take exposure to equity and debt through a single scheme?
Investors could, in principle, build a 70:30 portfolio themselves by holding separate equity and debt investments. In practice, maintaining that mix over via theDo-It- Yourself (DIY) approach invites friction as discussed below.
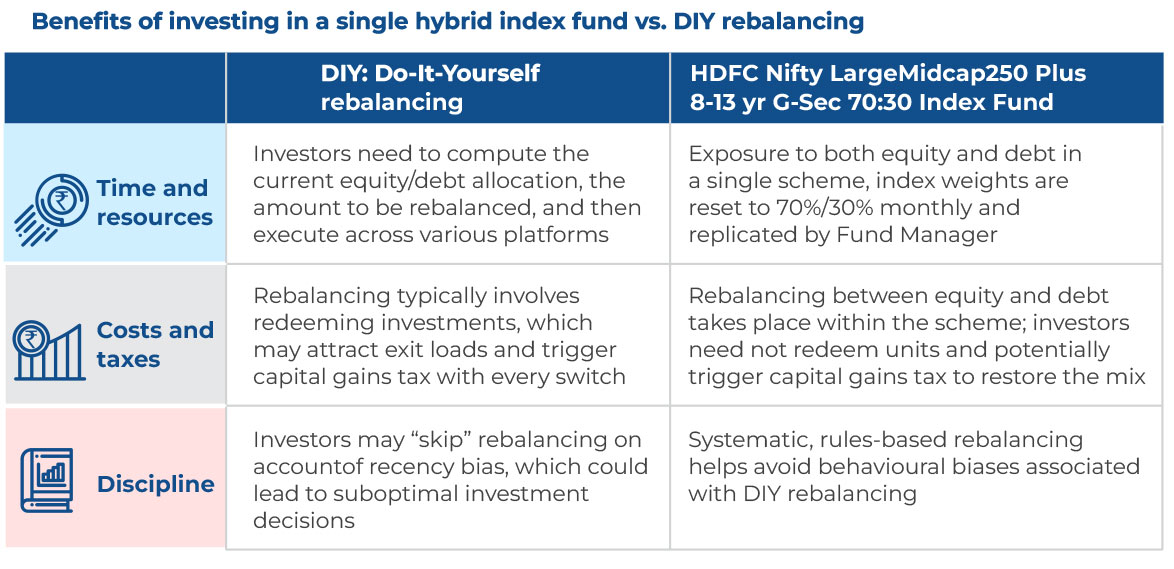
From a tax perspective, as rebalancing happens within the scheme, investors do not have to redeem units – andpotentially incur capital gains tax – each time the portfolio’s mix needs to be restored. Further, since its allocation todomestic equity is more than 65%, the Scheme is taxed as an equity-oriented mutual fund. In view of the individual nature of tax consequences, each investor is advised to consult his/her own professional tax advisor.
Conclusion
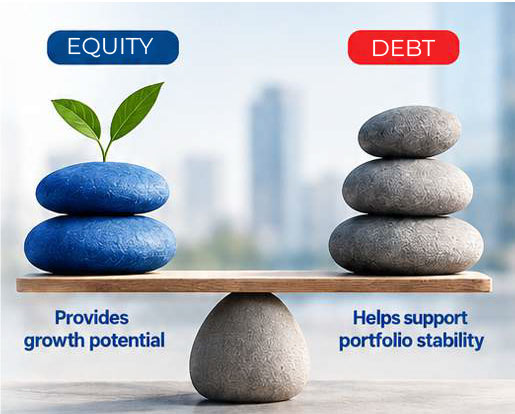
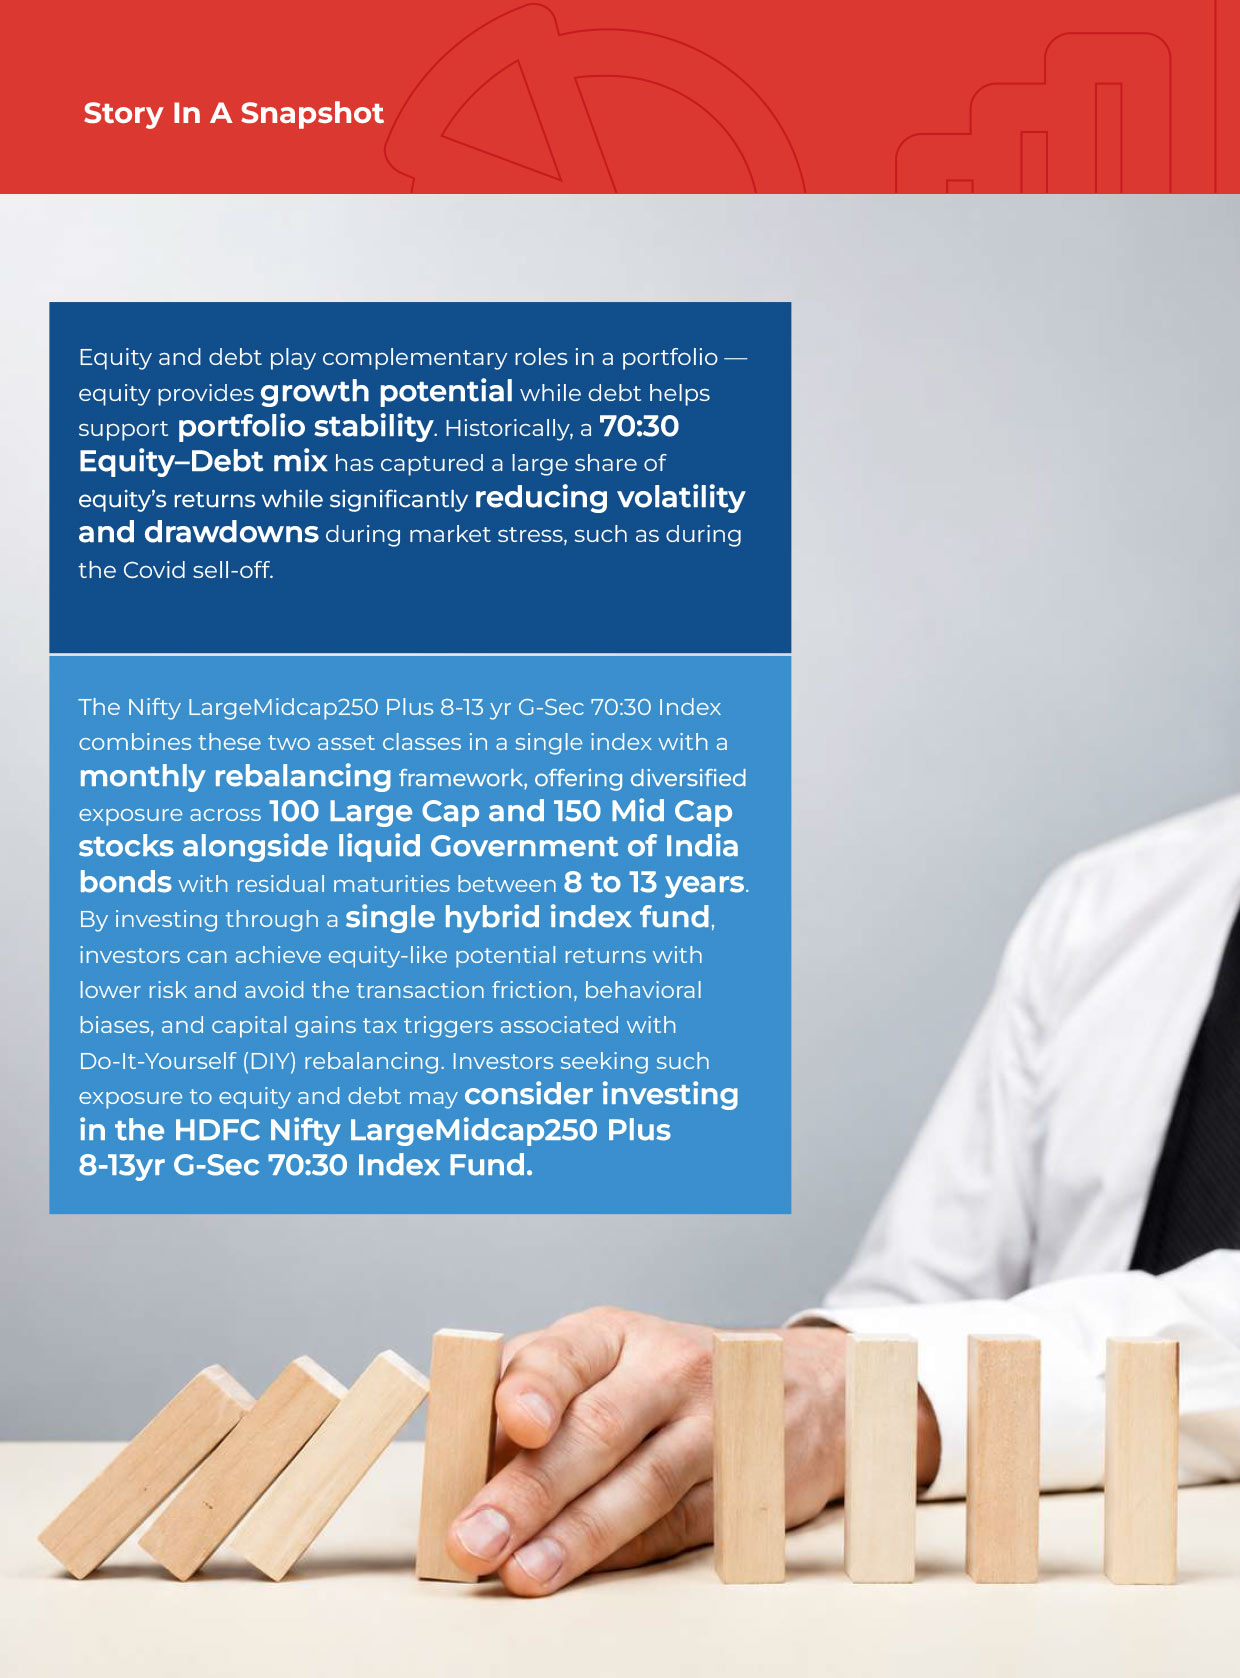
Equity and debt have historically played complementary roles – equity provides growth potential and debt helpssupport portfolio stability. With low correlation between the two and winners that keep changing, a combination of both may help balance portfolio volatility, improve riskadjusted returns and cushion drawdowns during periods of equity market stress. The Nifty Large Midcap250 Plus 8-13 yr G-Sec 70:30 Index brings this combination together in a single index, with diversified exposure across Large Cap and Mid Cap stocks and liquid Government of India bonds, rebalanced monthly.
The HDFC Nifty LargeMidcap250 Plus 8-13 yr G-Sec 70:30 Index Fund offers investors convenient access to this Equity–Debt combination in a single scheme, with systematic rebalancing helping avoid the frictions and behavioural biases associated with DIY rebalancing.

The Scheme may be suitable for investors who seek exposure to both equity and debt in a single scheme, prefer a rules-based allocation over managing and rebalancing multiple holdings themselves, and can remain invested over the long term. Investors seeking such exposure to equity and debt may consider investing in the HDFC Nifty LargeMidcap250 Plus 8-13yr G-Sec 70:30 Index Fund. The NFO is open from October 5 to October 19, 2026.
Source: NSE Indices Ltd., internal calculations, publicly available sources
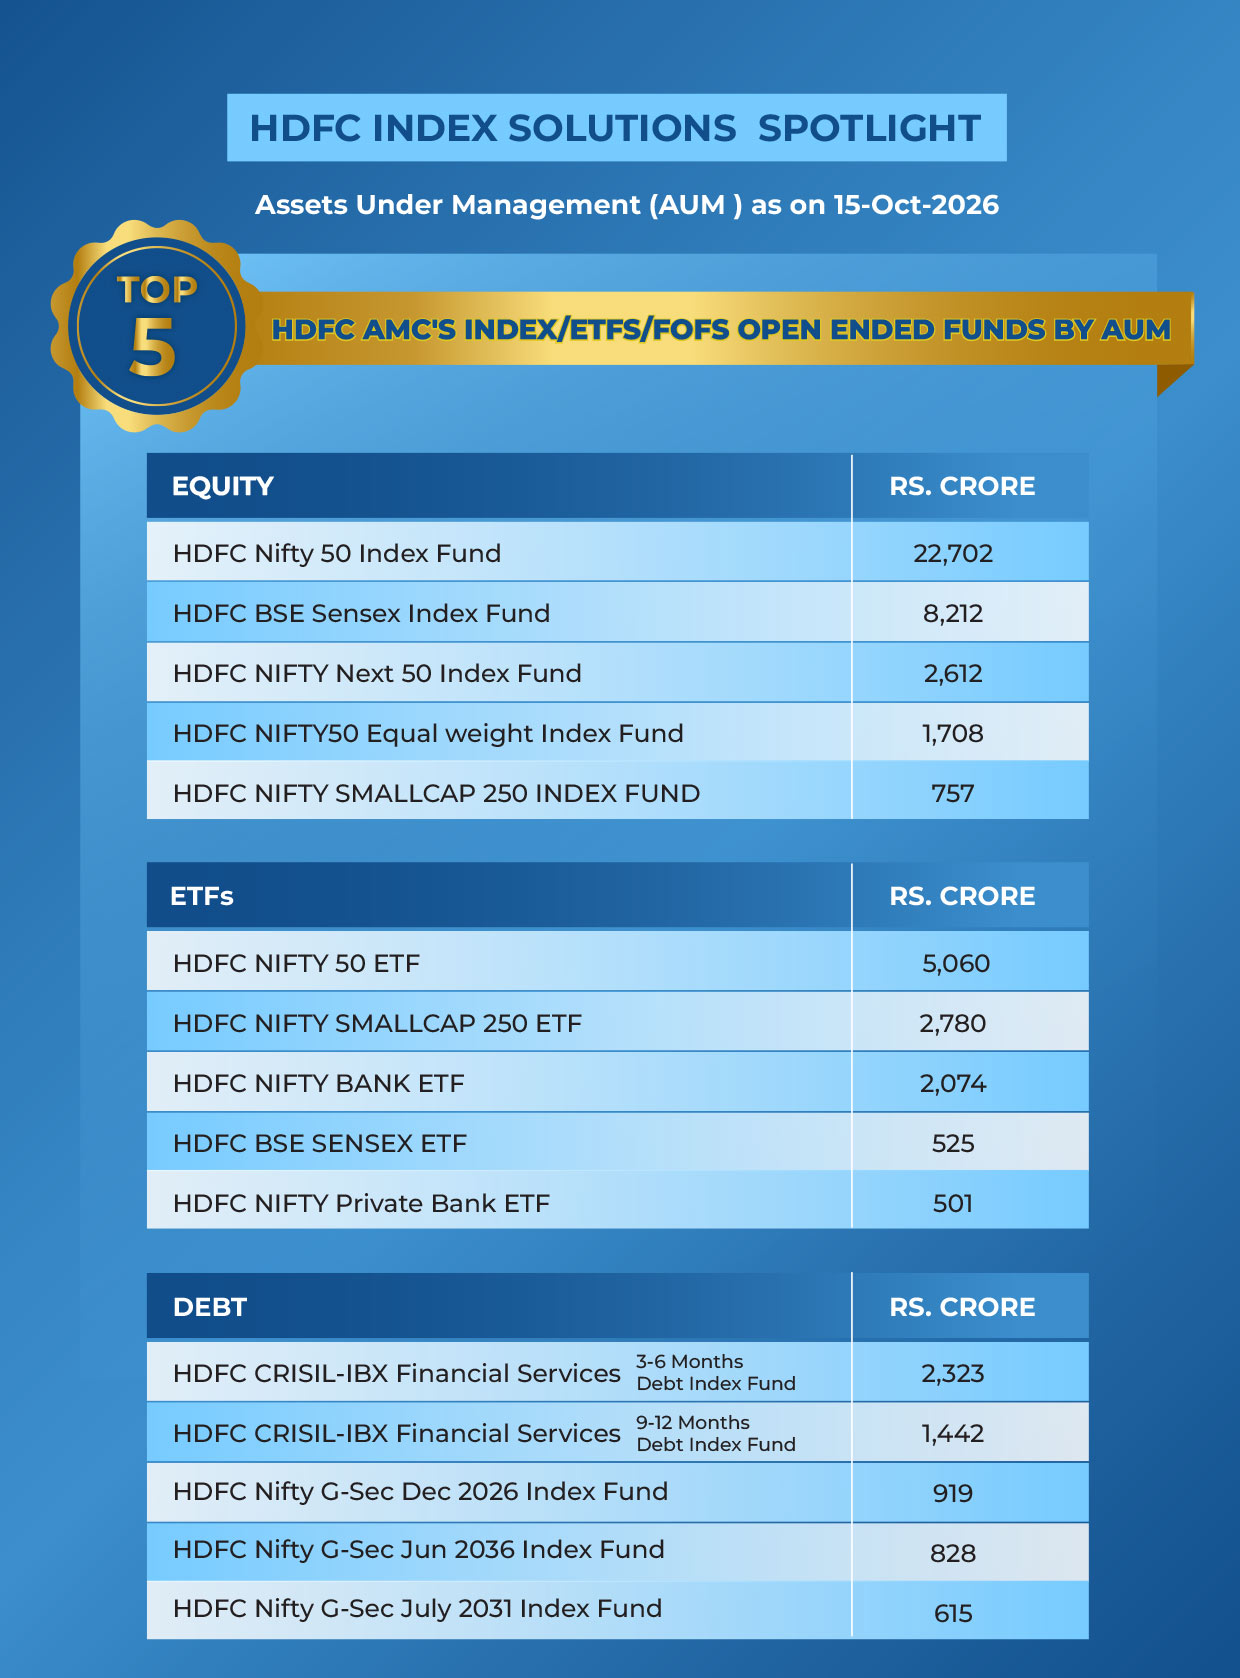
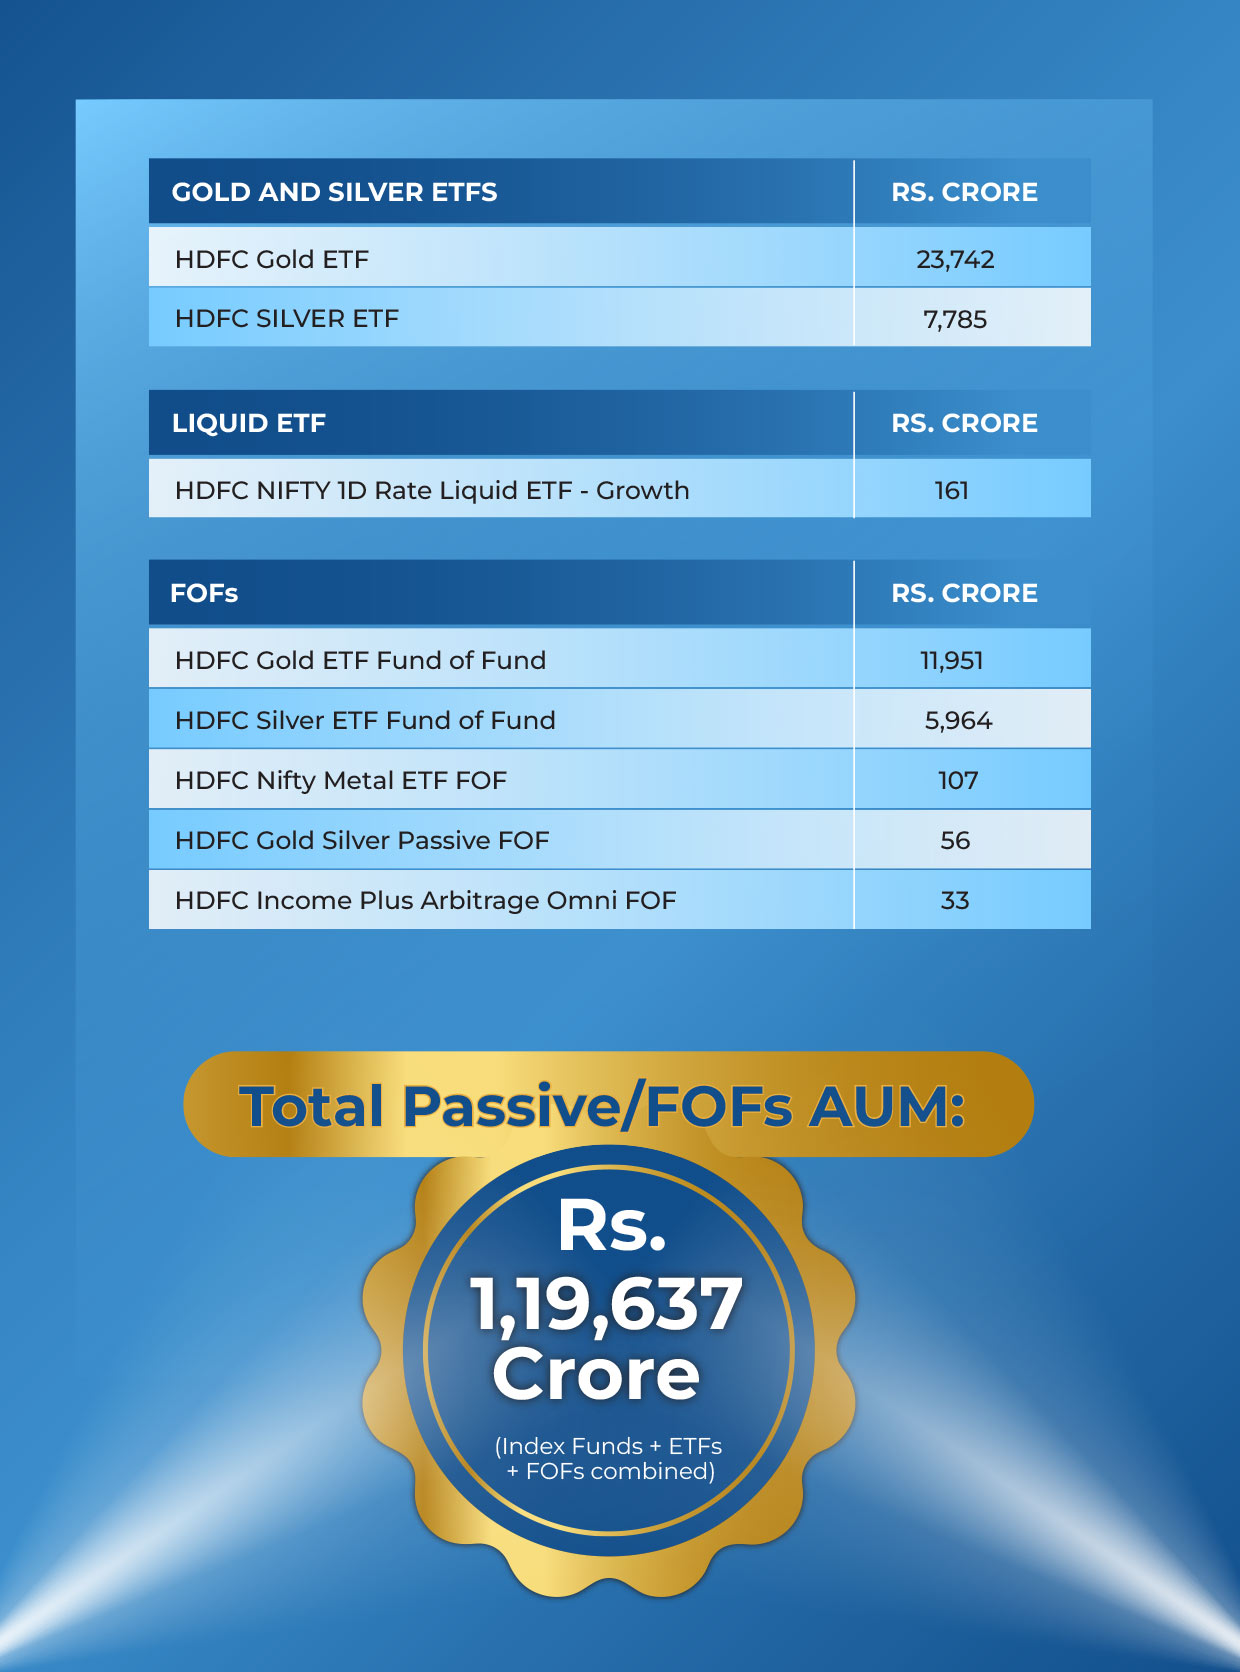
Dicionary term
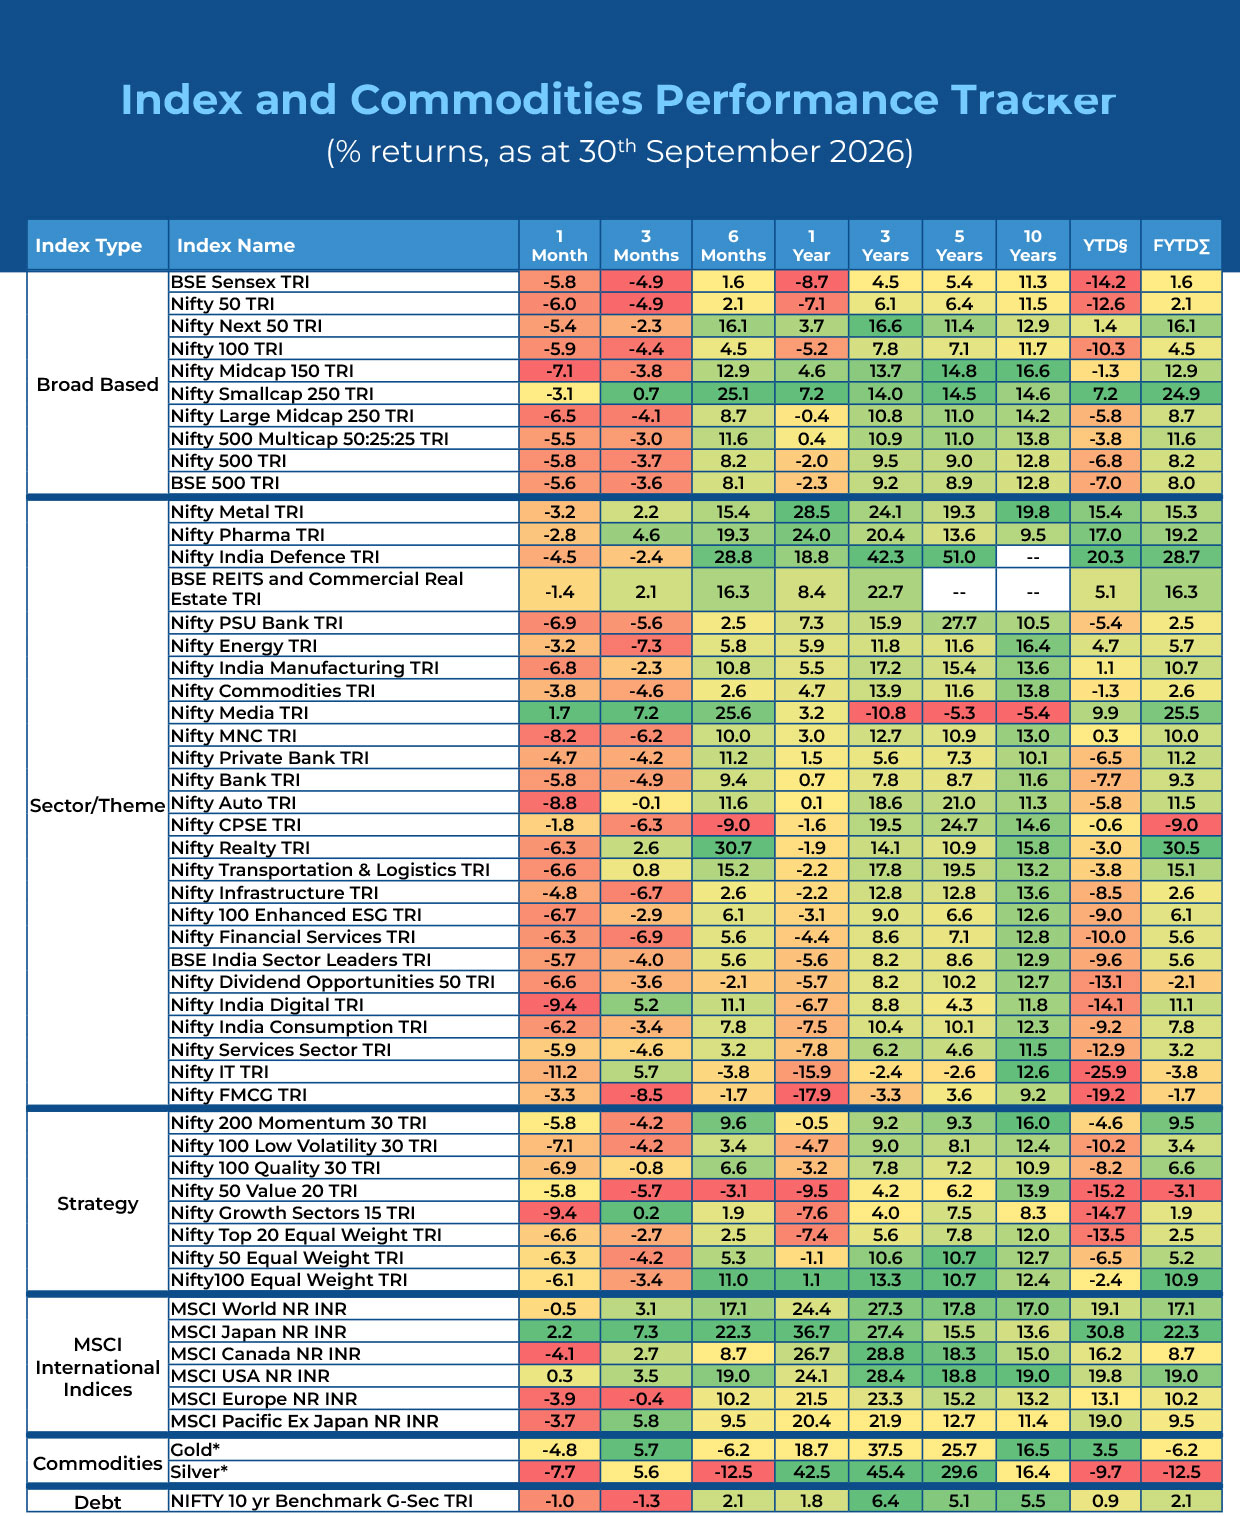
Source: MFI360 Explorer, Morningstar, Bloomberg, internal calculations. Past performance may or may not be sustained in future and is not a guarantee of any future returns.
Disclaimer: The data/statistics is given for general information purposes only and is not an investment advice. Neither HDFC AMC / HDFC Mutual Fund nor any person connected with them, accept any liability arising from the use of this document. The recipient(s) before acting on any information herein should make his/her/their own investigation and seek appropriate professional advice. *Gold and Silver prices in INR do not include any customs duties, local taxes etc. Returns less than 1 year period are simple and greater than 1 year period are compounded annualized (CAGR). § Year to date. Σ Financial year to date.
Date of Release: October 13, 2026
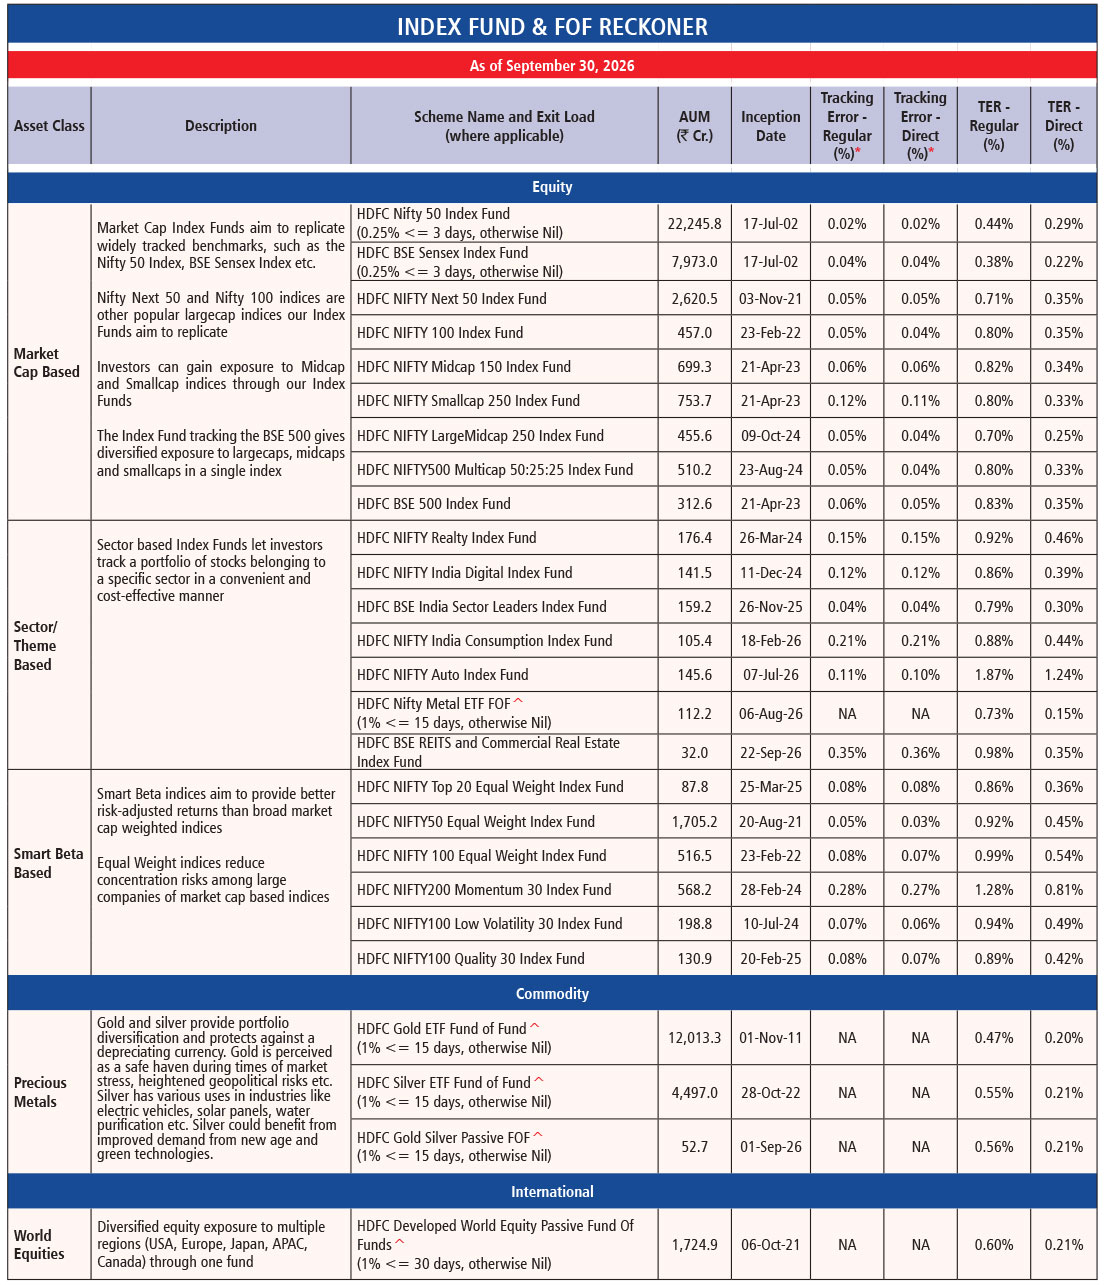
Source: www.hdfcfund.com N.A. - Not Available. TER - Total Expense Ratio (As at last day of the month). Including Additional Expenses and Goods and Service Tax on Management Fees * Annualised tracking error is calculated based on daily returns for the last 12 months ^Investors in the Scheme shall bear the recurring expenses of the Scheme in addition to the expenses of other schemes in which this Fund of Funds scheme makes investment (subject to regulatory limits)
Disclaimer: The information/data herein alone are not sufficient and should not be used for the development or implementation of an investment strategy. The recipient(s) before acting on any information herein should make his/her/their own investigation and seek appropriate professional advice and shall alone be fully responsible/liable for any decision taken on the basis of information contained herein.
NSE Disclaimer: The above mentioned Schemes offered by HDFC Asset Management Company Limited (HDFC AMC) having benchmark as NSE Indices are not sponsored, endorsed, sold or promoted by NSE INDICES LIMITED (formerly known as India Index Services & Products Limited (IISL)). NSE INDICES does not make any representation or warranty, express or implied (including warranties of merchantability or fitness for particular purpose or use) and disclaims all liability to the owners of the Products or any member of the public regarding the advisability of investing in securities generally or in the Products linked to the respective underlying indices of NSE to track general stock market performance in India. Please read the full disclaimers in the Offer Document of the Products.
BSE Disclaimer: The above mentioned schemes of HDFC AMC having benchmark as BSE Indices are based on the underlying indices of BSE. BSE®, BSE® and SENSEX® are registered trademarks of BSE Limited. The Schemes is not sponsored, endorsed marketed or promoted by BSE or their respective affiliates. Please refer to the Scheme Information Document for disclaimers.
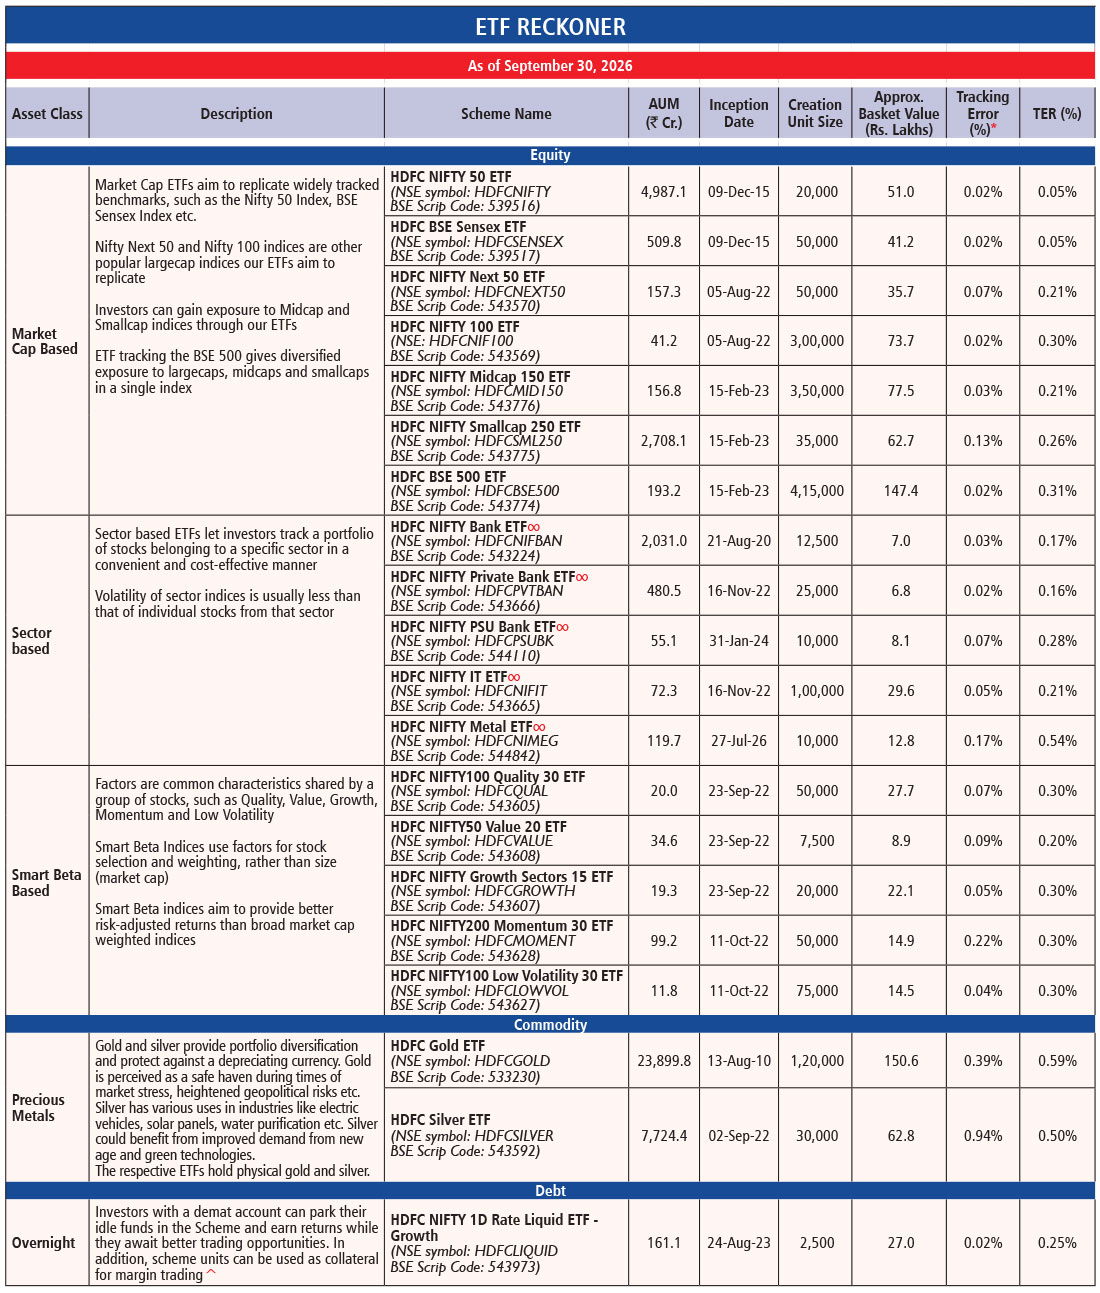
Source: www.hdfcfund.com N.A. - Not Available. TER -Total Expense Ratio (As at last day of the month). Including Additional Expenses and Goods and Service Tax on Management Fees.
∞ The Schemes being an Exchange Traded Fund investing in a specific sector carries higher risks versus diversified equity mutual funds on account of concentration and sector specific risks. * Annualised tracking error is calculated based on daily returns for the last 12 months. And for schemes that have completed less than 12 months, Annualised Standard Deviation (tracking error) has been calculated based on the available data, i.e. since inception. Exit load does not apply on ETFs. ^ Margin available / haircut applied depends on broker.
Disclaimer: The information/data herein alone are not sufficient and should not be used for the development or implementation of an investment strategy. The recipient(s) before acting on any information herein should make his/her/their own investigation and seek appropriate professional advice and shall alone be fully responsible/liable for any decision taken on the basis of information contained herein.
NSE Disclaimer: The above mentioned Schemes offered by HDFC Asset Management Company Limited (HDFC AMC) having benchmark as NSE Indices are not sponsored, endorsed, sold or promoted by NSE INDICES LIMITED (formerly known as India Index Services & Products Limited (IISL)). NSE INDICES LIMITED does not make any representation or warranty, express or implied (including warranties of merchantability or fitness for particular purpose or use) and disclaims all liability to the owners of the Products or any member of the public regarding the advisability of investing in securities generally or in the Products linked to the respective underlying indices of NSE to track general stock market performance in India. Please read the full Disclaimers in the Offer Document of the Products.
BSE Disclaimer: The above mentioned schemes of HDFC AMC having benchmark as BSE Indices are based on the underlying indices of BSE. BSE® and SENSEX® are registered trademarks of BSE Limited. The Schemes is not sponsored, endorsed marketed or promoted by BSE or their respective affiliates. Please refer to the Scheme Information Document for disclaimers.
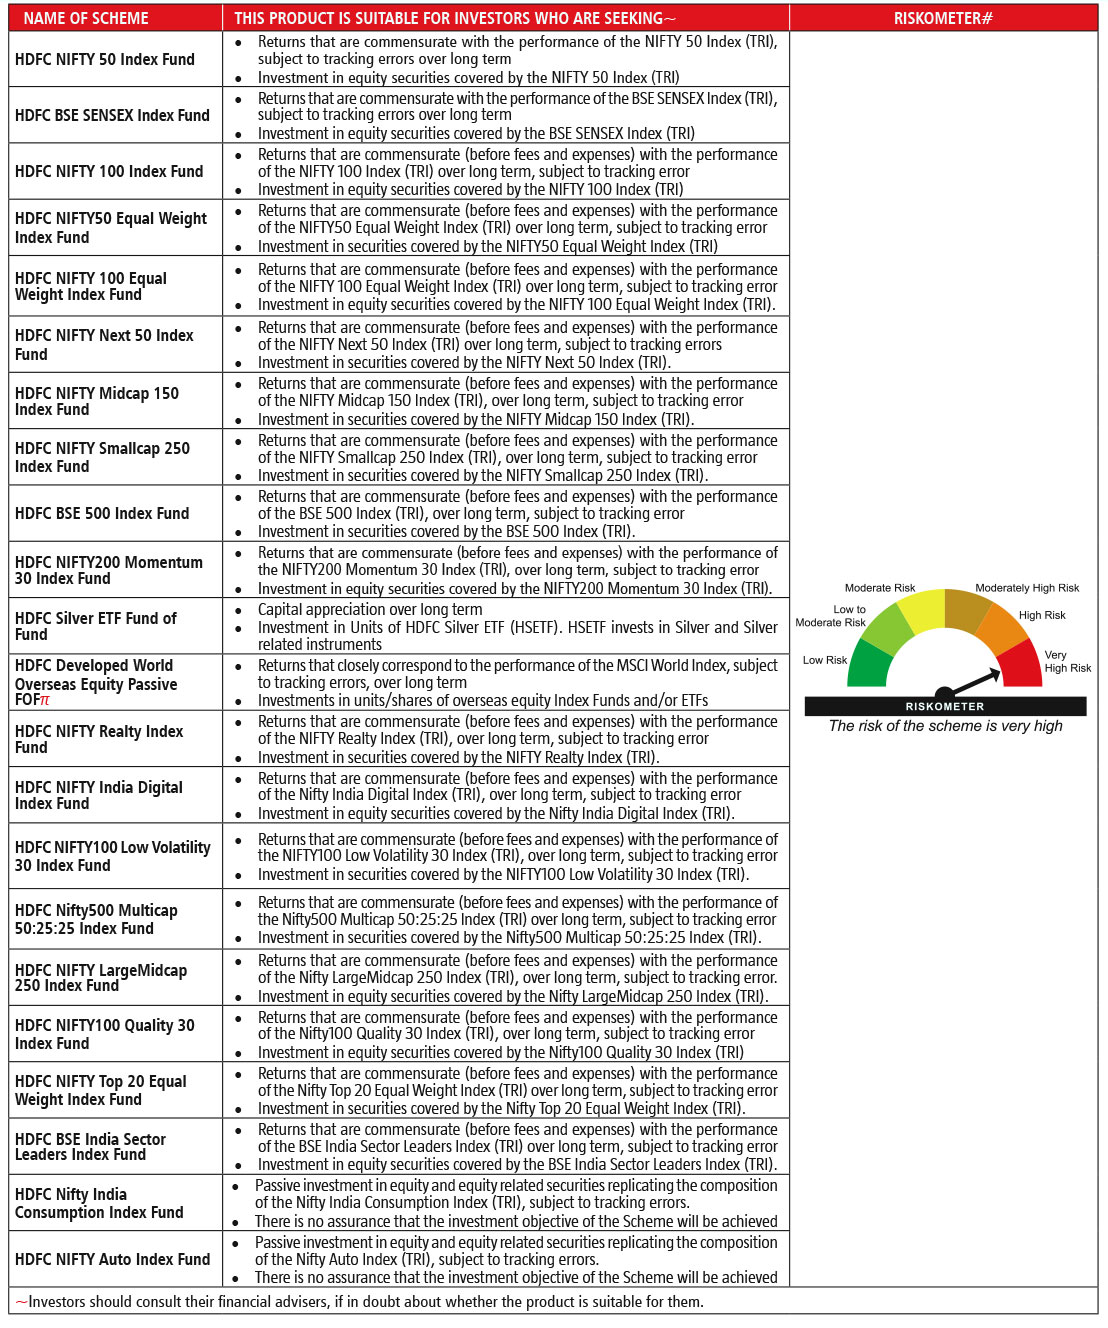
Riskometer as on September 30, 2026. For latest riskometer, investors may refer to the Monthly Portfolios disclosed on the website of the Fund viz. www.hdfcfund.com π Investors in the Scheme shall bear the recurring expenses of the Scheme in addition to the expenses of other schemes in which this Fund of Fund scheme makes investment (subject to regulatory limits).
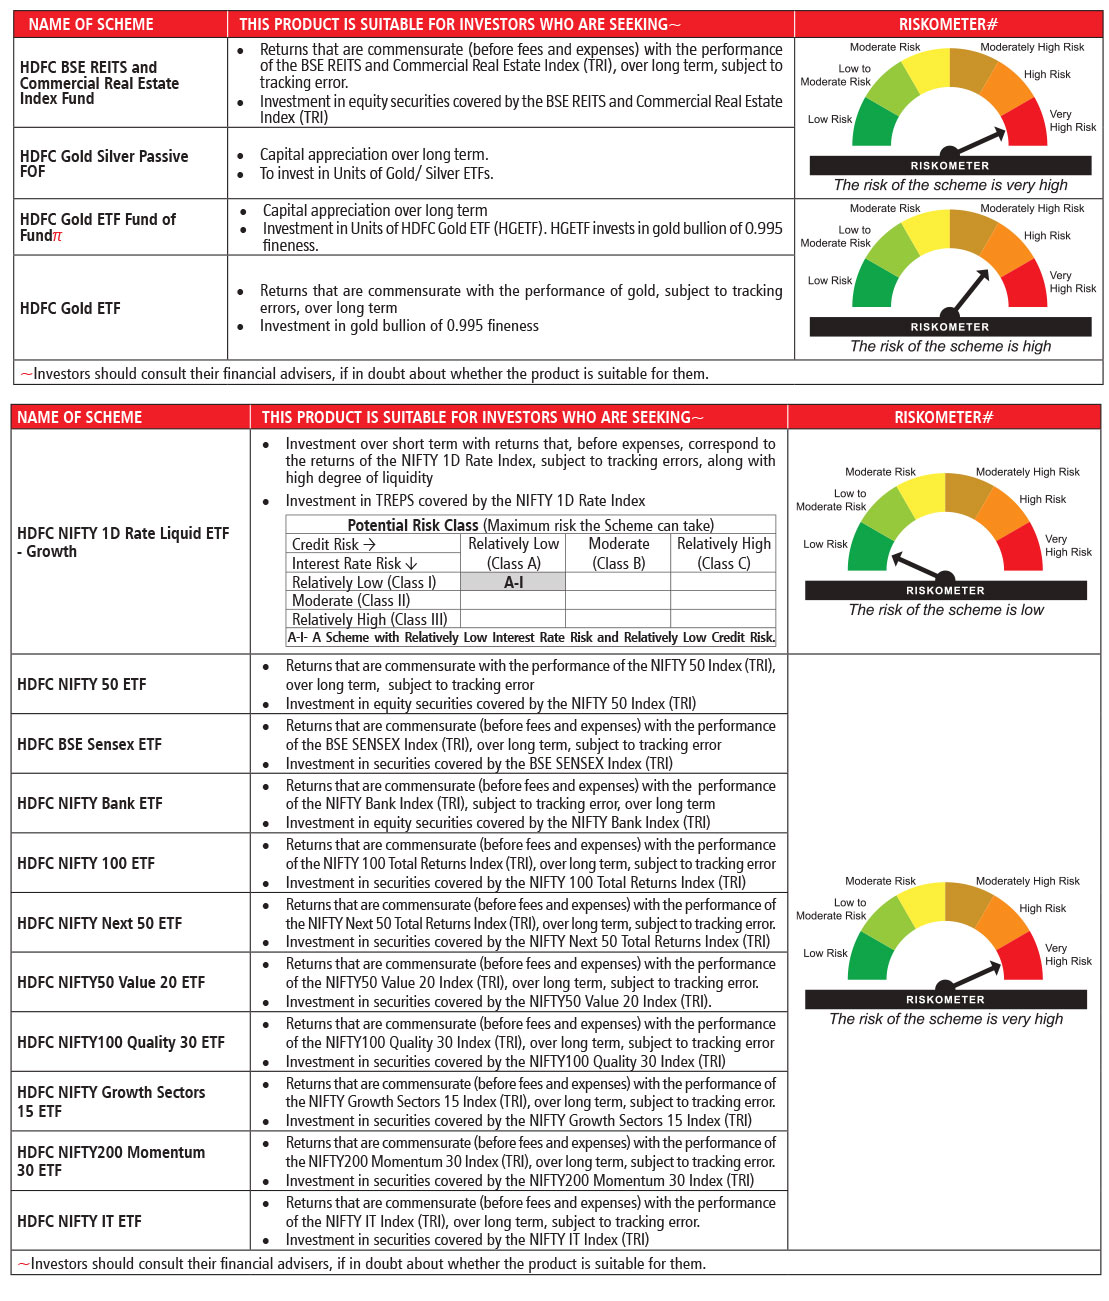
Riskometer as on September 30, 2026. For latest riskometer, investors may refer to the Monthly Portfolios disclosed on the website of the Fund viz. www.hdfcfund.com π Investors in the Scheme shall bear the recurring expenses of the Scheme in addition to the expenses of other schemes in which this Fund of Fund scheme makes investment (subject to regulatory limits).
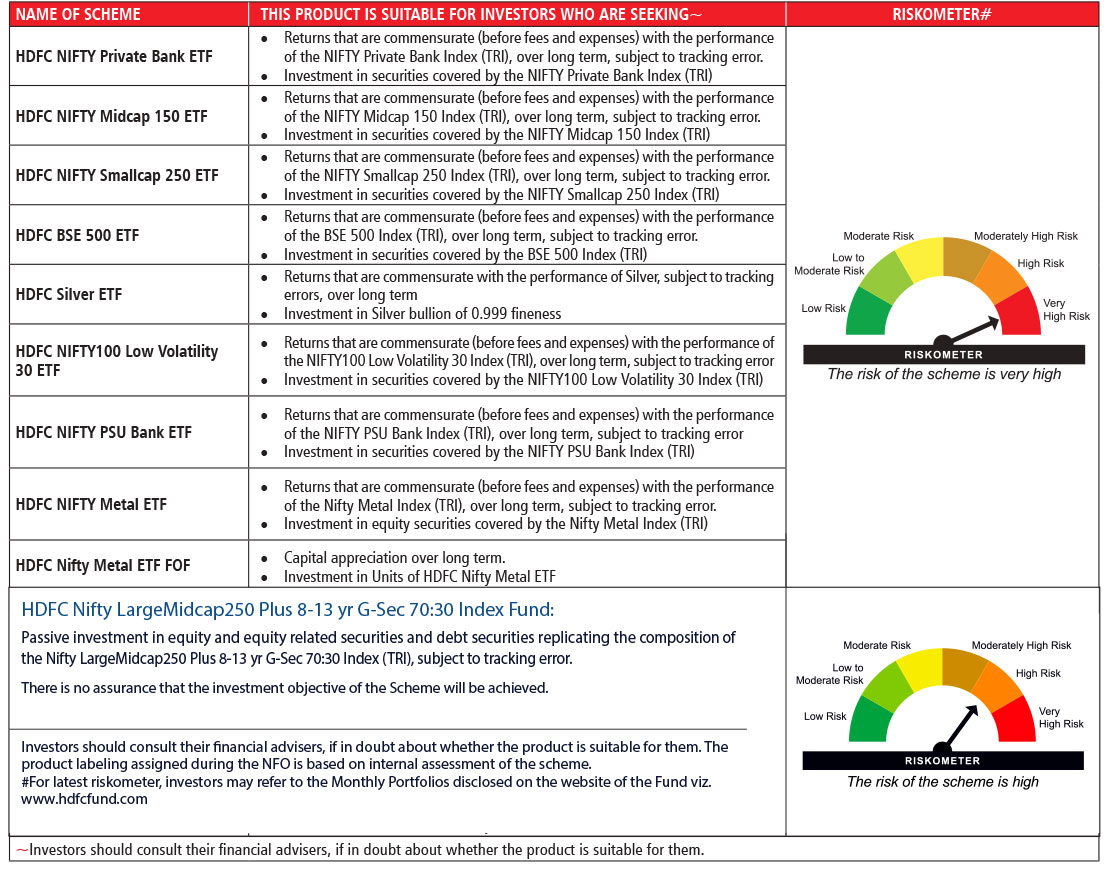
Riskometer as on September 30, 2026. For latest riskometer, investors may refer to the Monthly Portfolios disclosed on the website of the Fund viz. www.hdfcfund.com π Investors in the Scheme shall bear the recurring expenses of the Scheme in addition to the expenses of other schemes in which this Fund of Fund scheme makes investment (subject to regulatory limits).
NSE Disclaimer: The above mentioned Schemes offered by HDFC Asset Management Company Limited (HDFC AMC) having benchmark as NSE Indices are not sponsored, endorsed, sold or promoted by NSE INDICES LIMITED (formerly known as India Index Services & Products Limited (IISL)). NSE INDICES LIMITED does not make any representation or warranty, express or implied (including warranties of merchantability or fitness for particular purpose or use) and disclaims all liability to the owners of the Products or any member of the public regarding the advisability of investing in securities generally or in the Products linked to the respective underlying indices of NSE to track general stock market performance in India. Please read the full Disclaimers in the Offer Document of the Products.
BSE Disclaimer: The above mentioned schemes of HDFC AMC having benchmark as BSE Indices are based on the underlying indices of BSE. BSE® and SENSEX® are registered trademarks of BSE Limited. The Schemes is not sponsored, endorsed marketed or promoted by BSE or their respective affiliates. Please refer to the Scheme Information Document for disclaimers.
MSCI Disclaimer: HDFC Developed World Overseas Equity Passive FOF is not sponsored, endorsed, sold or promoted by MSCI. All MSCI indexes are owned by MSCI and provided as-is without any warranties. MSCI assumes no liability for or in connection with the MSCI indexes. Please refer the Scheme Information Document for complete disclaimer.
CRISIL Disclaimer and Copyright Notice : “© CRISIL Limited. All Rights Reserved Each CRISIL Index (including, for the avoidance of doubt, its values and constituents) is the sole property of CRISIL Limited (CRISIL). No CRISIL Index may be copied, retransmitted or redistributed in any manner. While CRISIL uses reasonable care in computing the CRISIL Indices and bases its calculation on data that it considers reliable, CRISIL does not warrant that any CRISIL Index is error-free, complete, adequate or without faults. Anyone accessing and/or using any part of the CRISIL Indices does so subject to the condition that: (a) CRISIL is not responsible for any errors, omissions or faults with respect to any CRISIL Index or for the results obtained from the use of any CRISIL Index; (b) CRISIL does not accept any liability (and expressly excludes all liability) arising from or relating to their use of any part of CRISIL Indices.
The views are based on internal data, publicly available information and other sources believed to be reliable. The statements contained herein are based on our current views and involve known and unknown risks and uncertainties that could cause actual results, performance or events to differ materially from those expressed or implied in such statements. Stocks/Sectors referred are illustrative and not recommended by HDFC Mutual Fund (“the Fund”)/ HDFC AMC. The Schemes of the Fund may or may not have any present or future positions in these sectors. It should not be construed as an investment advice or a research report or a recommendation by the Fund/HDFC AMC to buy or sell the stock or any other security covered under the respective sector/s. The Fund/ HDFCAMC is not guaranteeing any returns on investments made in the Scheme(s). Past performance may or may not be sustained in future and is not a guarantee of any future returns. HDFC Asset Management Company Limited (“HDFC AMC”) does not warrant the completeness or accuracy of the information herein. Neither HDFC AMC, nor any person connected with it, accepts any liability arising from the use of this material. The recipient(s) should before taking any decision, should make their own investigation and seek appropriate professional advice.
Date of Release: 30th October, 2026
MUTUAL FUND INVESTMENTS ARE SUBJECT TO MARKET RISKS, READ ALL SCHEME RELATED DOCUMENTS CAREFULLY.
Receive Index Insider every month for insights shaping the passive investing world
Did you find this interesting?
Your opinion matters - share your thoughts and help us improve.