
- Entering text into the form field will trigger a list of options
Trending Searches
- Invest / Login
Nifty200 Momentum 30 Index June 2026 portfolio review - ‘Capital’izing on ongoing market trends!
Last Updated On: 7 Aug 2026
|Created On: 6 Aug 2026
5 min read

• There have been 22 replacements in the Index in total, with companies entering from a wide range of sectors

• Capital Goods, Power and Metals & Mining sectors have seen their weights increase the most in the June 2026 review vs. the previous review in December 2025. The Financial Services and Auto sectors have seen their weights decline the most vs. the previous review

• The Nifty200 Momentum 30 Index continues to historically outperform the Nifty 200 Index over long-term horizons
The first half of 2026 witnessed considerable market volatility and dispersion in sector performances on account of the West Asia conflict. As a result, companies from sectors with strong recent performance, including Capital Goods, Power and Metals & Mining have seen their weights increase in the Momentum portfolio, at the expense of companies from sectors with subdued performance on account of the conflict viz. Financial Services and Auto sectors.
Key takeaways from the June 2026 review of the Nifty 200 Momentum 30 Index include:
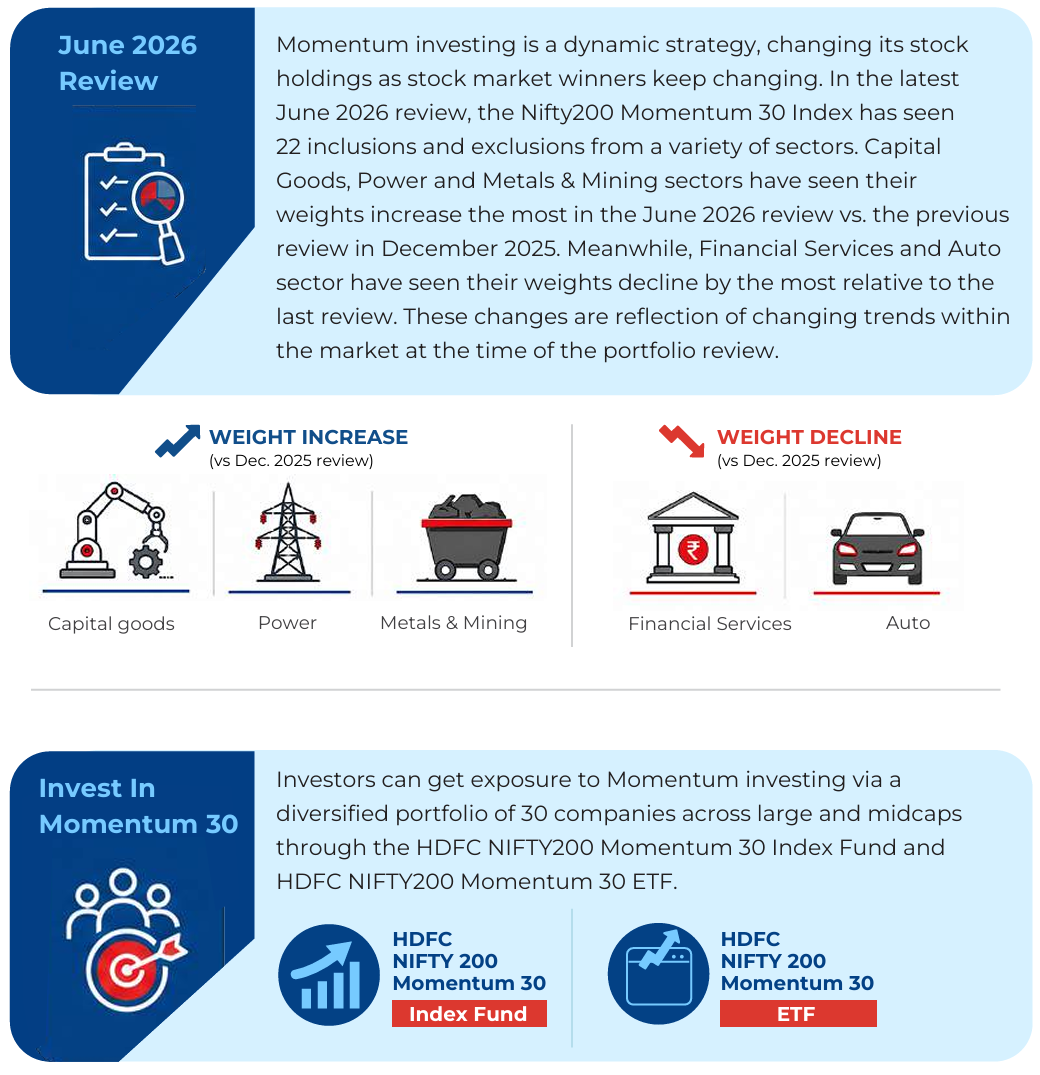
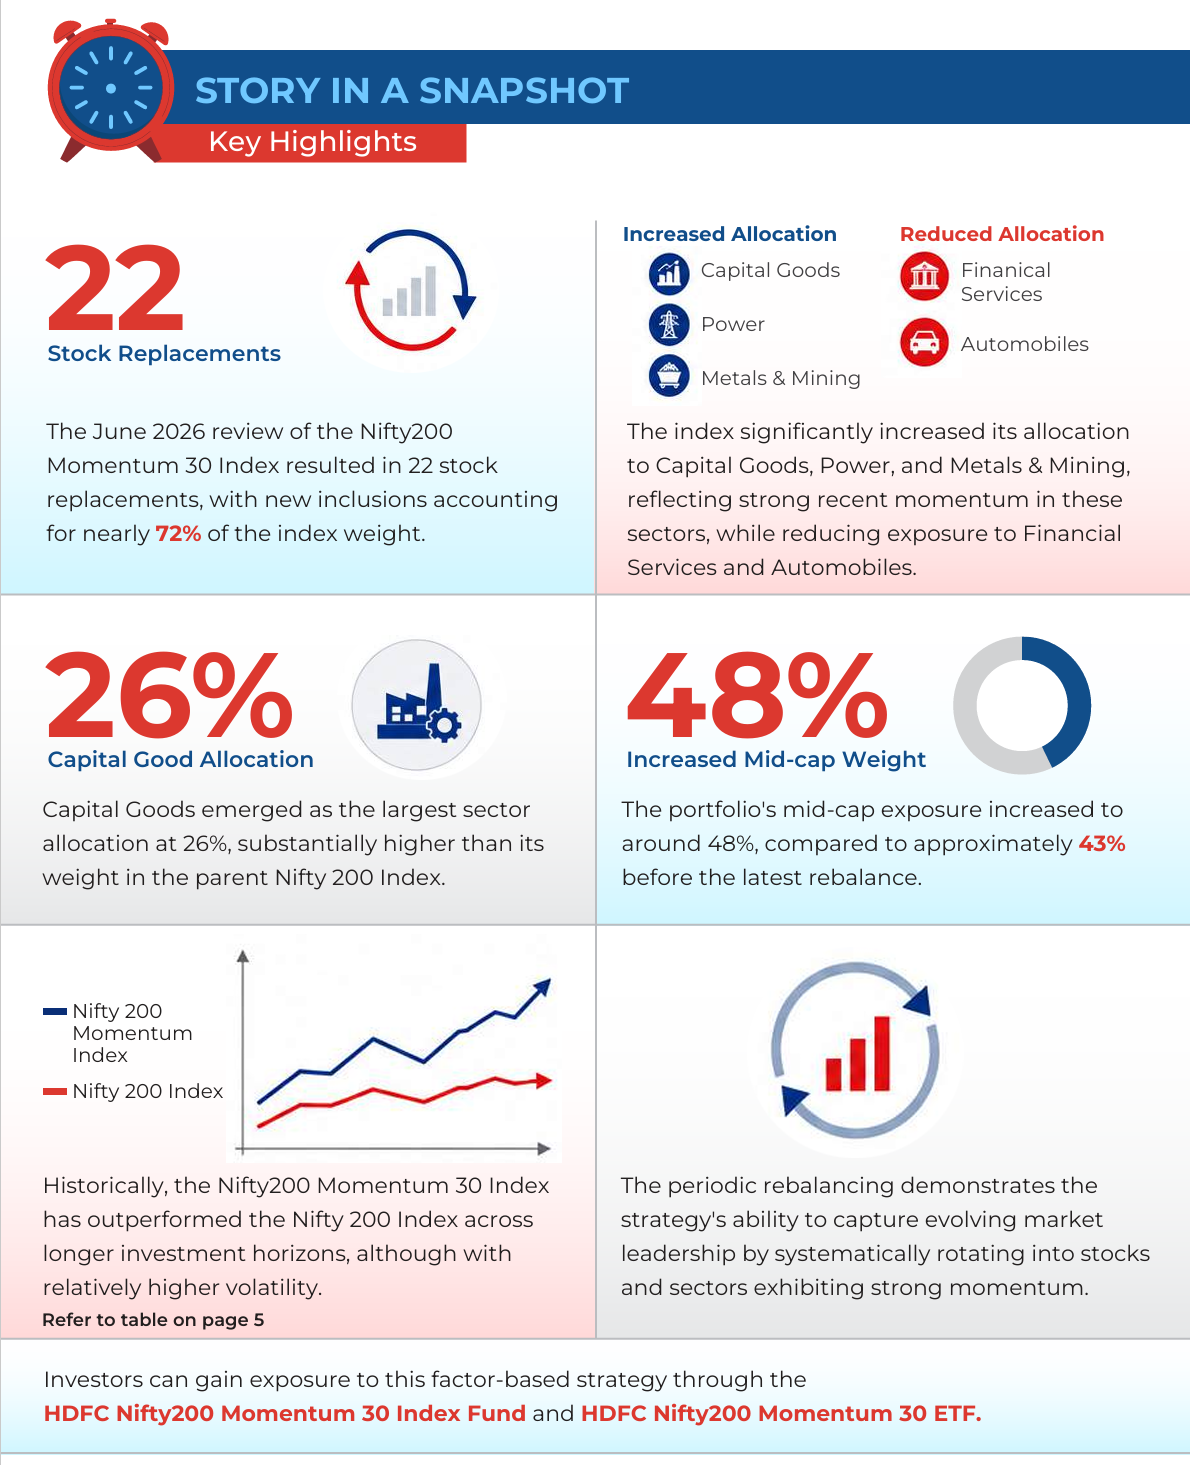
- There were total of 22 inclusions & exclusions – Inclusions accounted for ~72% of the index by weight (see Appendix for further details)
- Notable changes in sector weights between Jun 2026 and Dec 2025 include:
- Capital Goods, Power and Metals & Mining have got a significant boost in weight in the Momentum index, at the expense of Financial Services, Auto and Services sector
- Capital Goods have the highest weight in the Momentum Index at ~26% weight, around 19.7 percentage points (pp.) higher than the Nifty 200 weight of 6.5%. Inclusions are largely from the Heavy Electrical Equipment and Cables- Electrical basic industries
- The Financial Services sector’s weight has dropped to 21% as of Jun 2026 vs. 48% in Dec 2025. Exits include select PSU banks, insurance companies etc.
The Nifty200 Momentum 30 Index has increased exposure to Capital Goods, Power and Metals & Mining sectors relative to last portfolio review
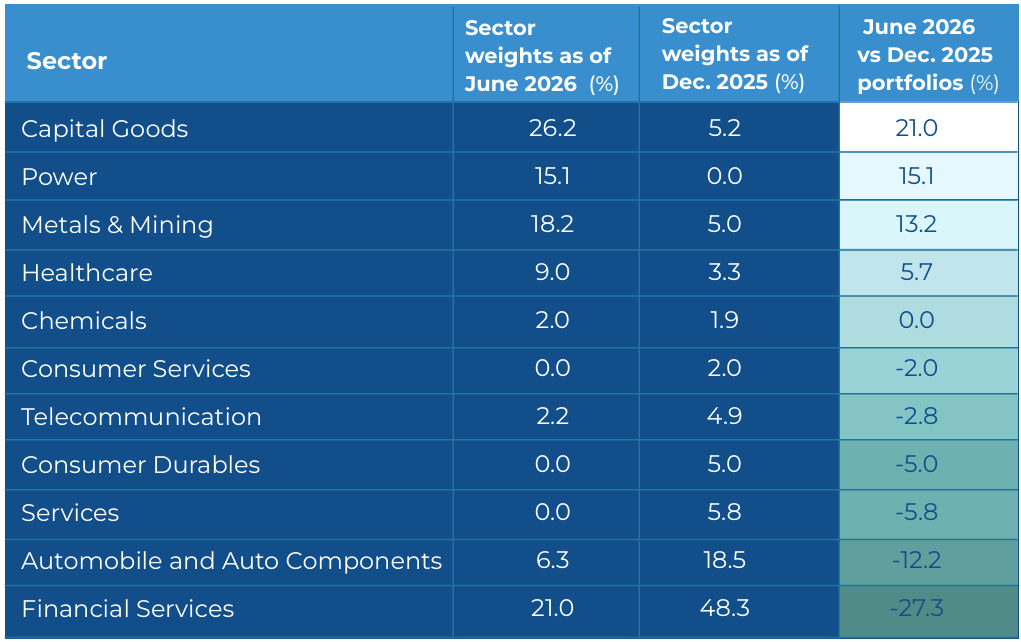
Source: NSE Indices Ltd., internal calculations. Data as of Jun 30, 2026.
The current portfolio also has a materially different sector distribution from its parent Nifty 200 Index. Please refer to the Appendix for this information.
The weight of Midcaps has increased relative to the previous rebalance, with Midcaps^ accounting for ~48% of the portfolio as of Jun 30, 2026 compared to ~43% prior to the latest portfolio review.
^ Midcaps and Largecaps have been classified as index constituents which are part of the Nifty Midcap 150 Index and Nifty 100 Index respectively
The Nifty200 Momentum 30 TRI has outperformed the Nifty 200 TRI over long-term horizons
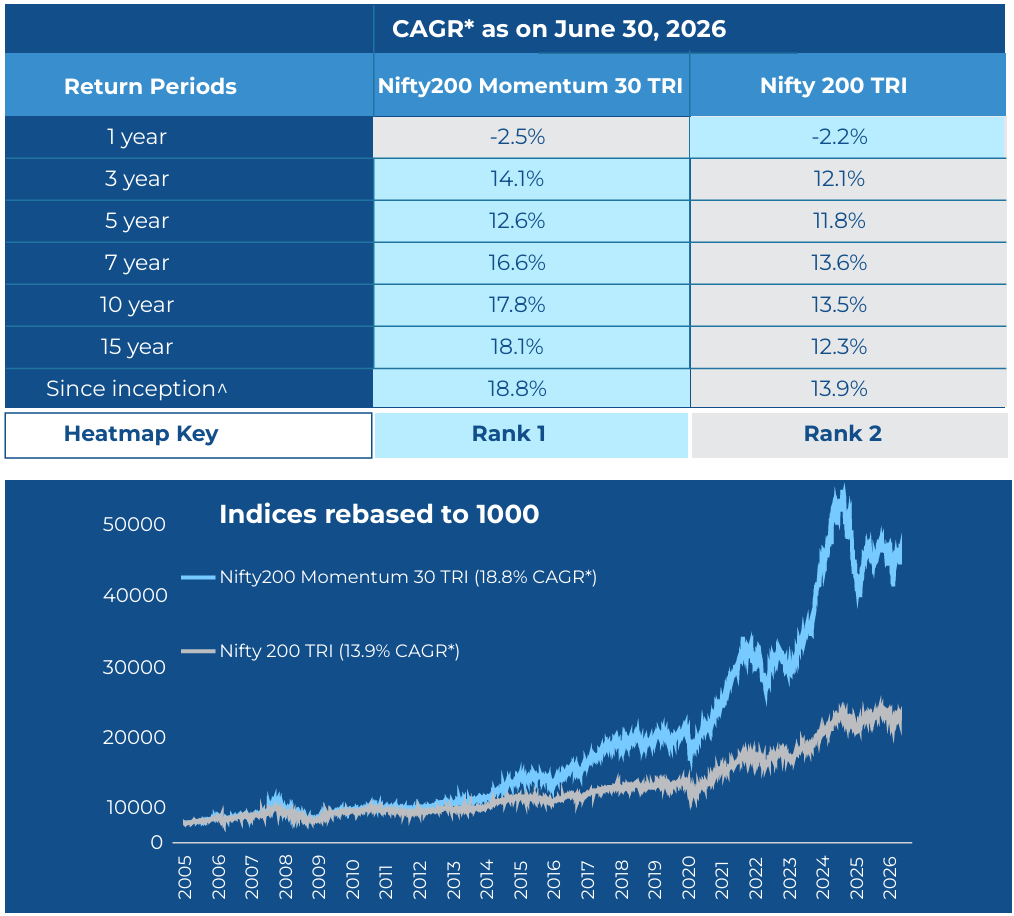
Source: NSE Indices Ltd. and internal calculations. As on Jun 30, 2026. ^Apr 1, 2005 has been chosen as the base date since both indices have values from this date onwards. Past performance may or may not be sustained in the future and is not a guarantee of any future returns. HDFC AMC/Mutual Fund is not guaranteeing or promising or forecasting any returns. *CAGR: Compounded Annual Growth Rate, TRI - Total Returns Index.
The Nifty200 Momentum 30 TRI has generated higher average rolling returns, with higher volatility, than the Nifty 200 TRI
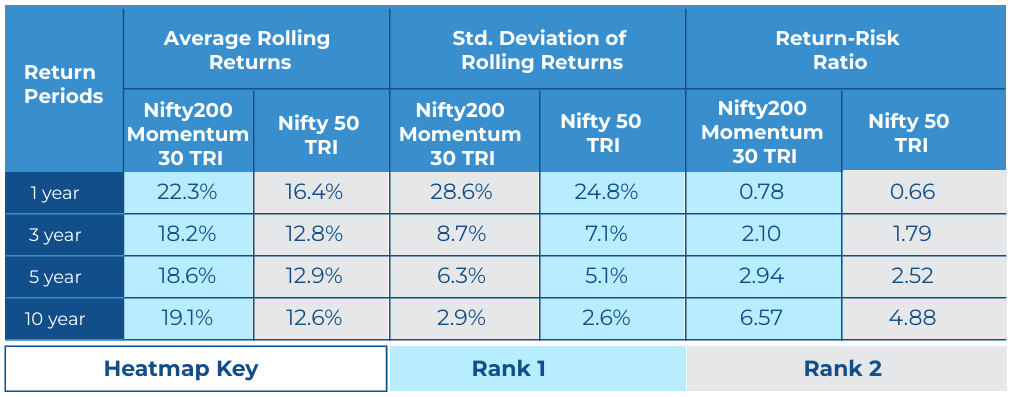
Source: NSE Indices Ltd. and internal calculations. Based on daily rolling returns of Nifty200 Momentum 30 TRI and Nifty 200 TRI. Return Period: Apr 01, 2005 to Jun 30, 2026 for the abovementioned indices, since Nifty200 Momentum 30 Index has TRI values from Apr 01, 2005 onwards. Return Risk Ratio = Average Rolling Returns/Std. Deviation of Rolling Returns. Past performance may or may not be sustained in the future and is not a guarantee of any future returns. HDFC AMC/Mutual Fund is not guaranteeing or promising or forecasting any returns. Source: NSE Indices Ltd., Bloomberg, internal calculations, publicly available sources

Conclusion
Appendix
Current portfolio & changes (8 continuing stocks vs. 22 new additions)
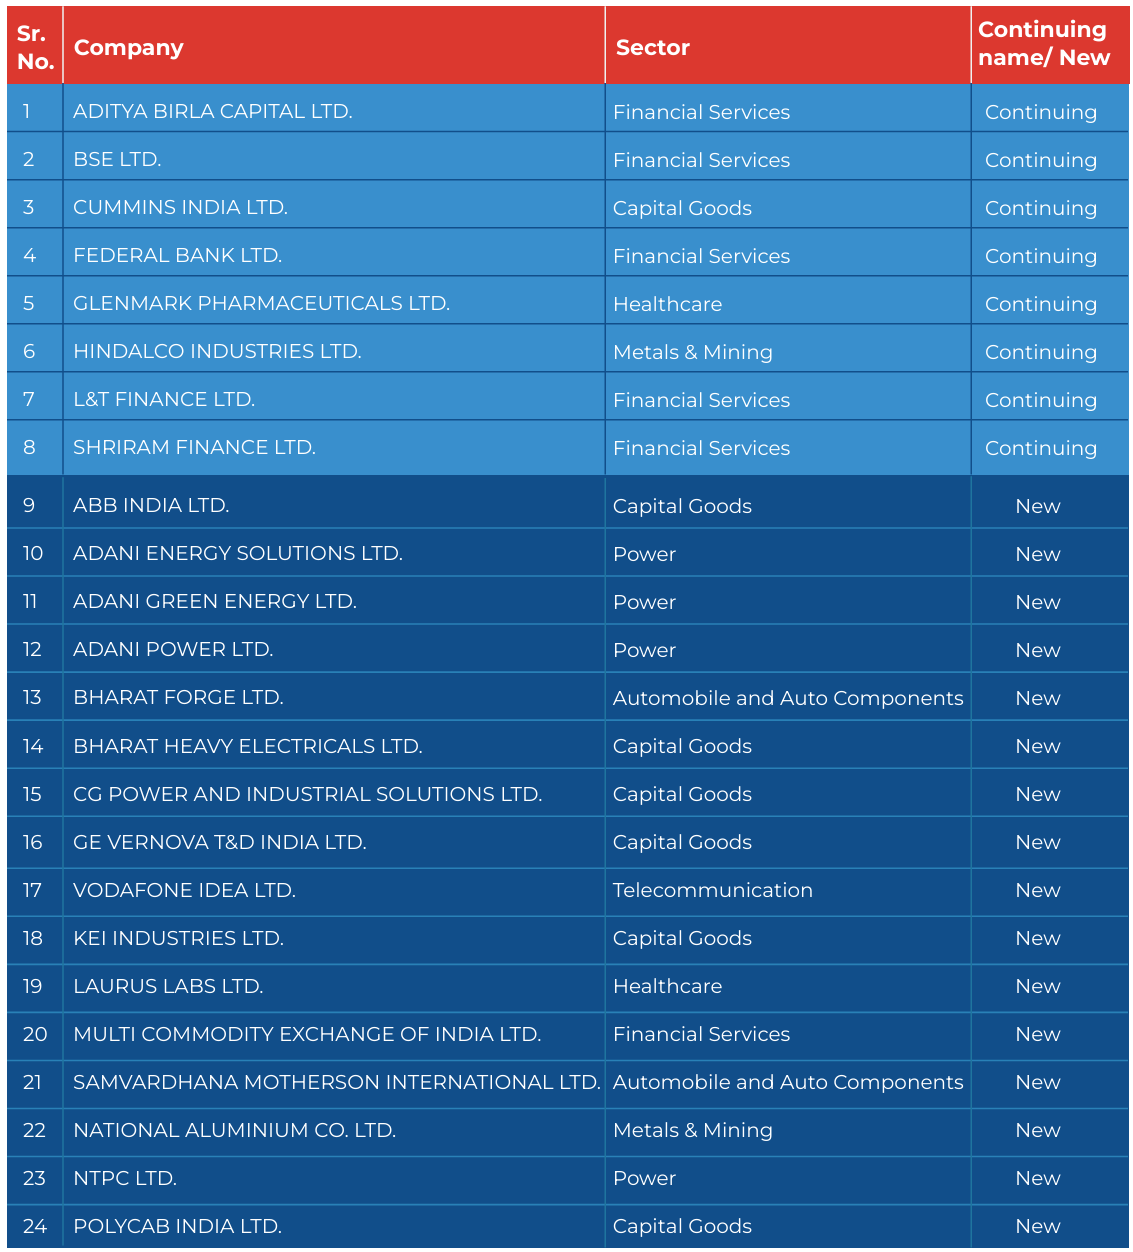
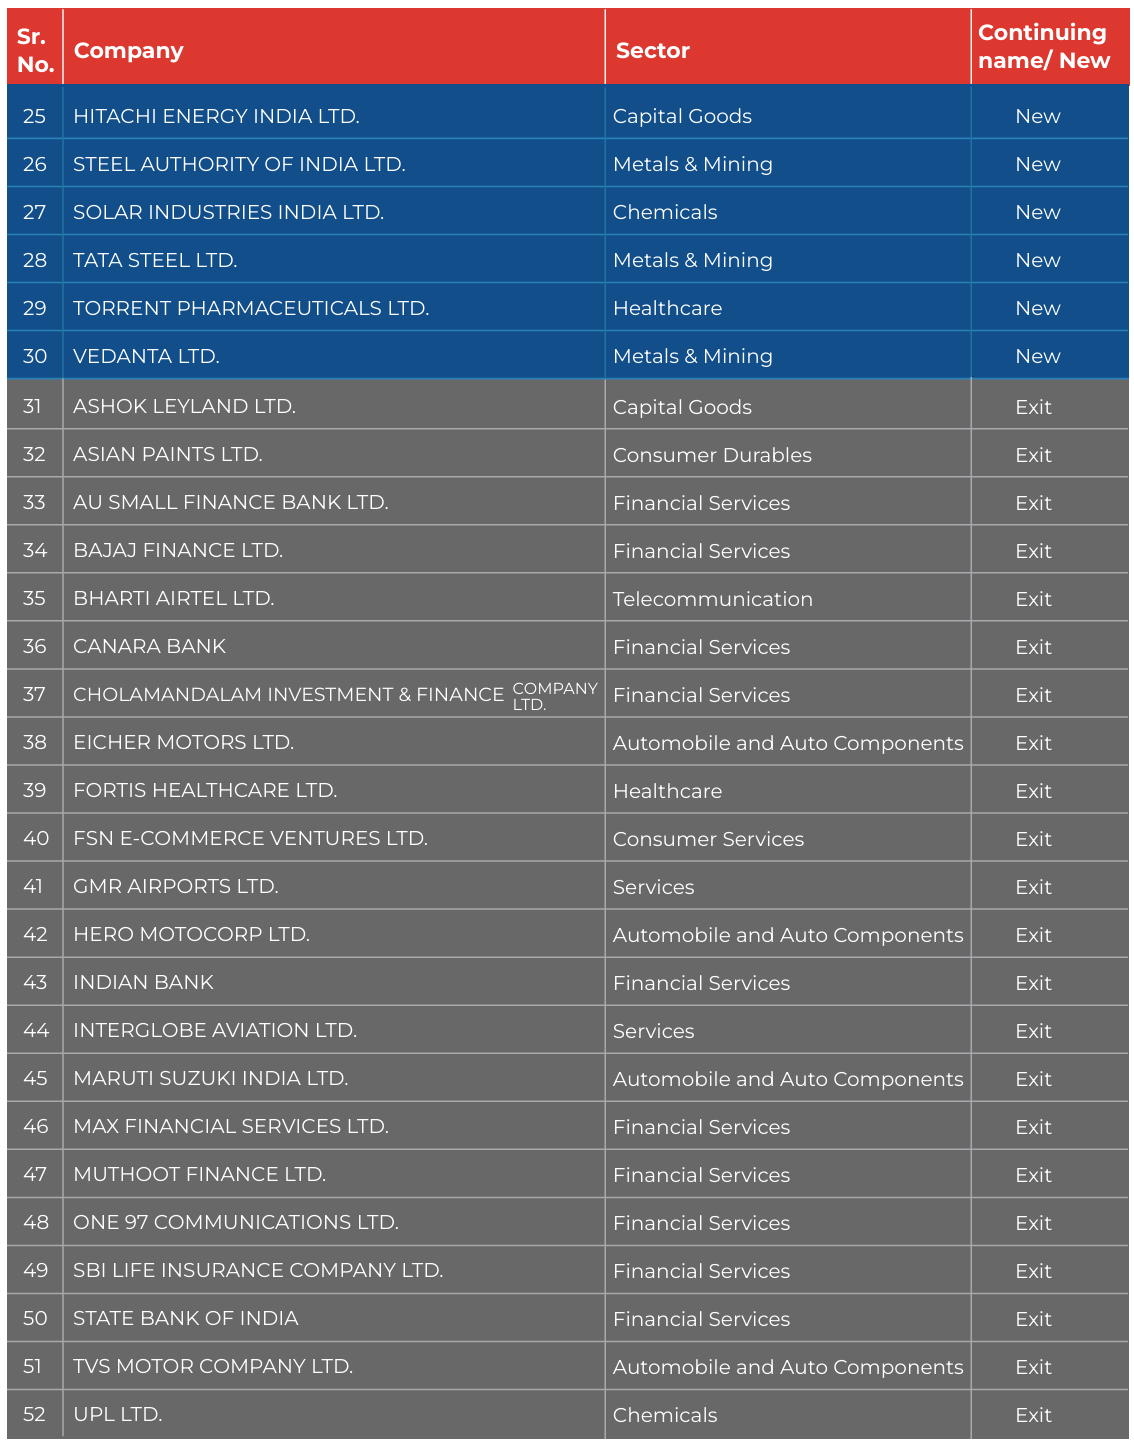
Source: NSE Indices Ltd., internal calculations. Data as of Jun 30, 2026
Sector distribution vs Nifty 200 – Momentum Index is overweight Capital Good, Metals & Mining and Power vs. parent Nifty 200 Index
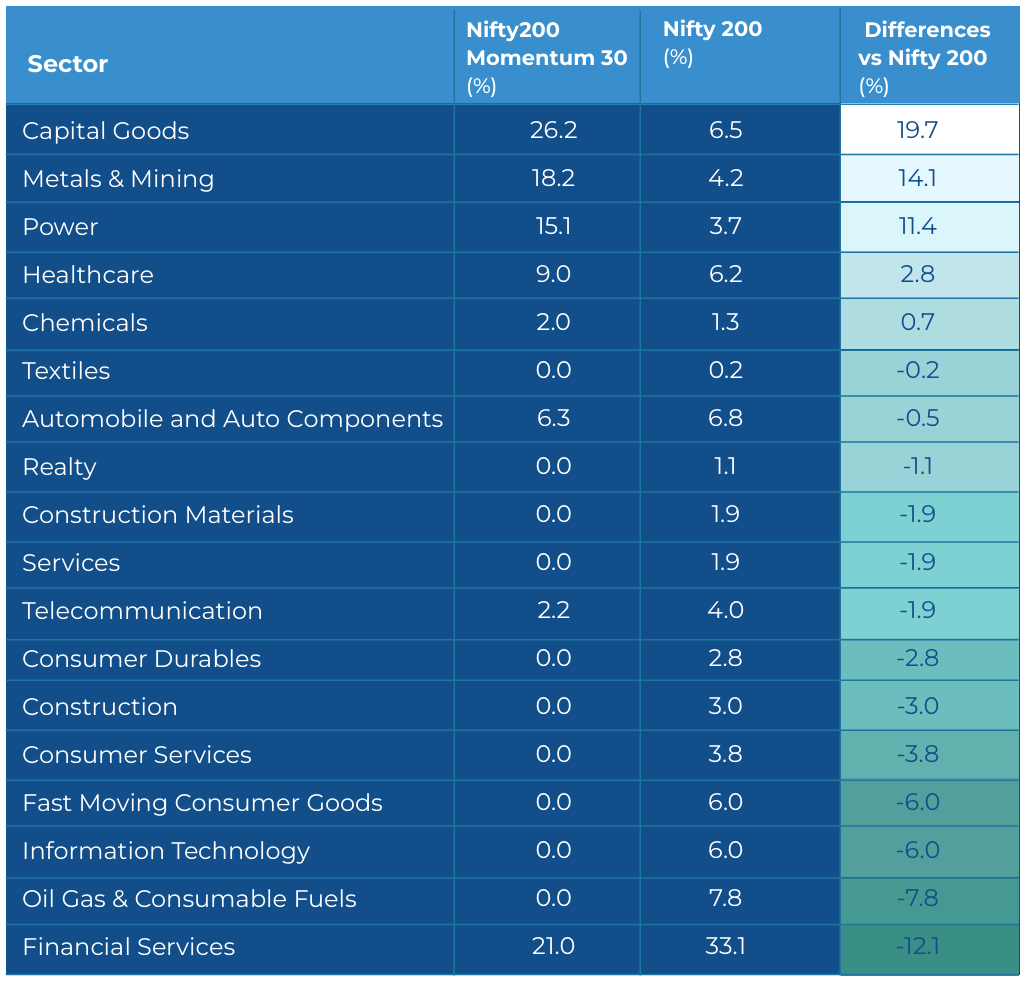
Source: NSE Indices Ltd., internal calculations. Data as of Jun 30, 2026
Source: Bloomberg, NSE Indices Ltd., internal calculations, publicly available sources
Source: NSE Indices Ltd., Bloomberg, internal calculations, publicly available sources.
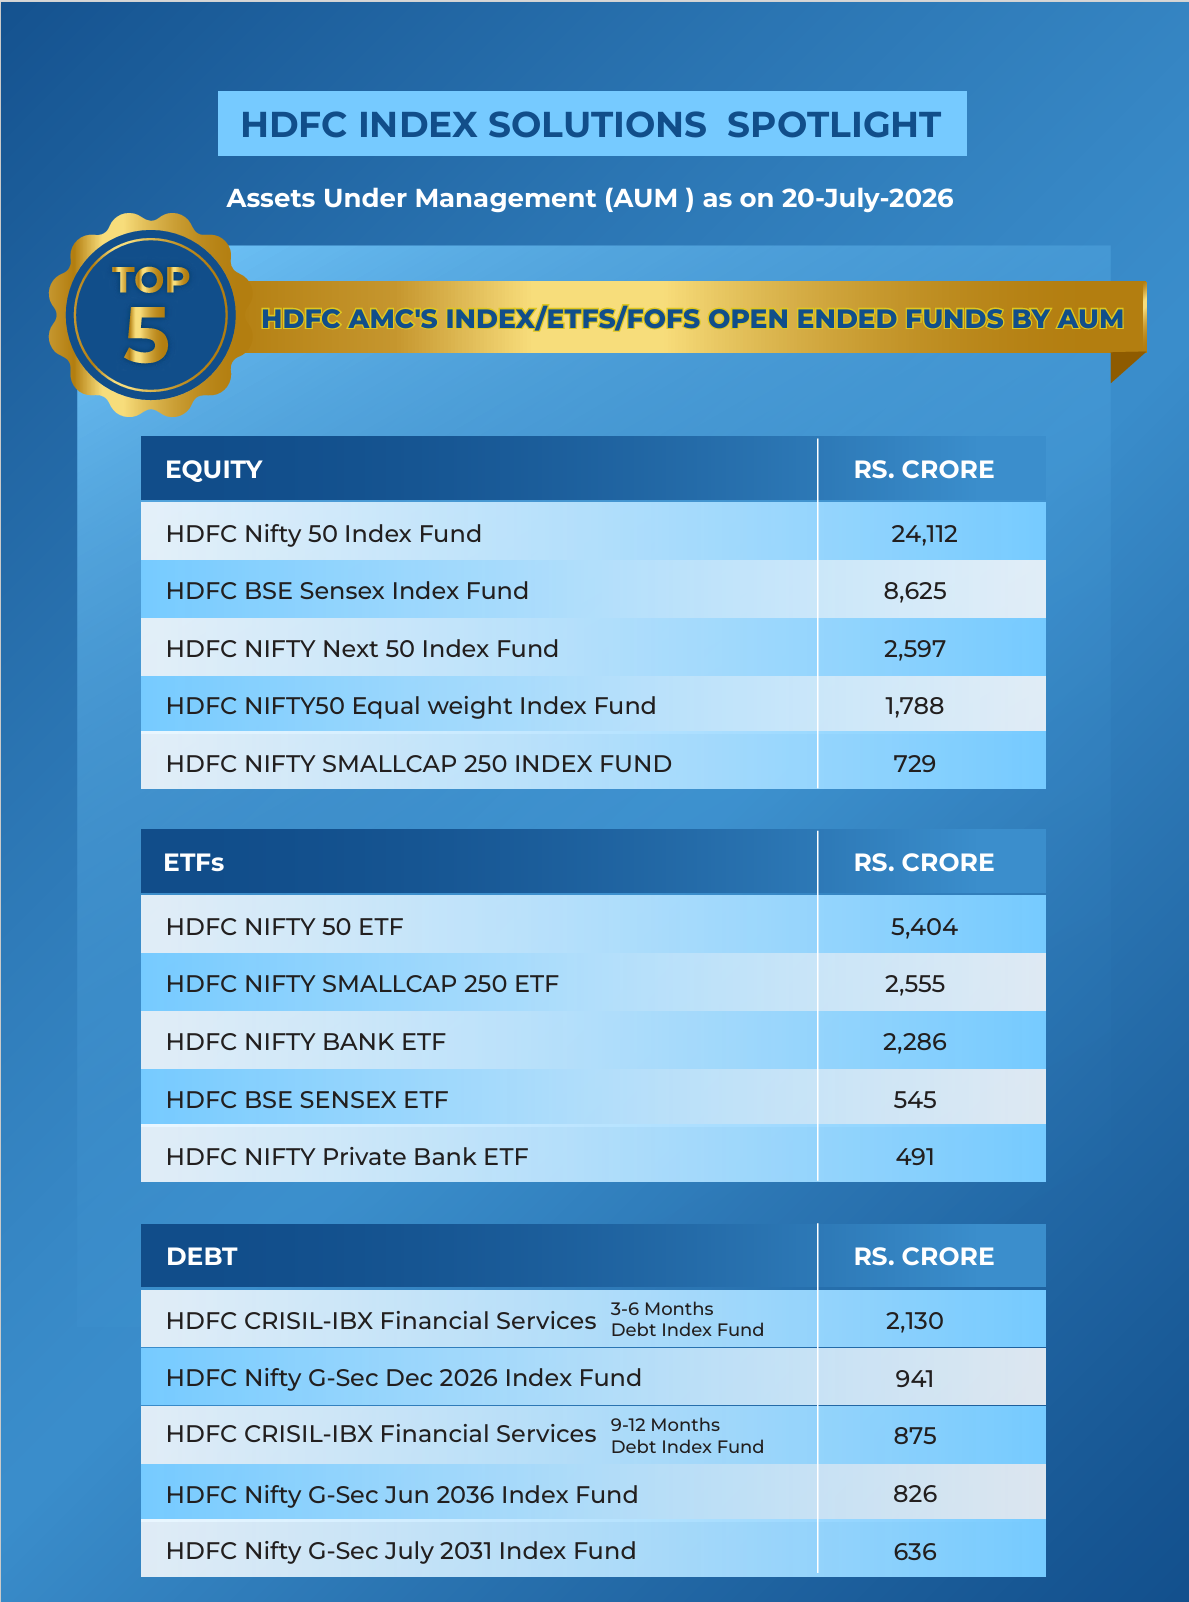
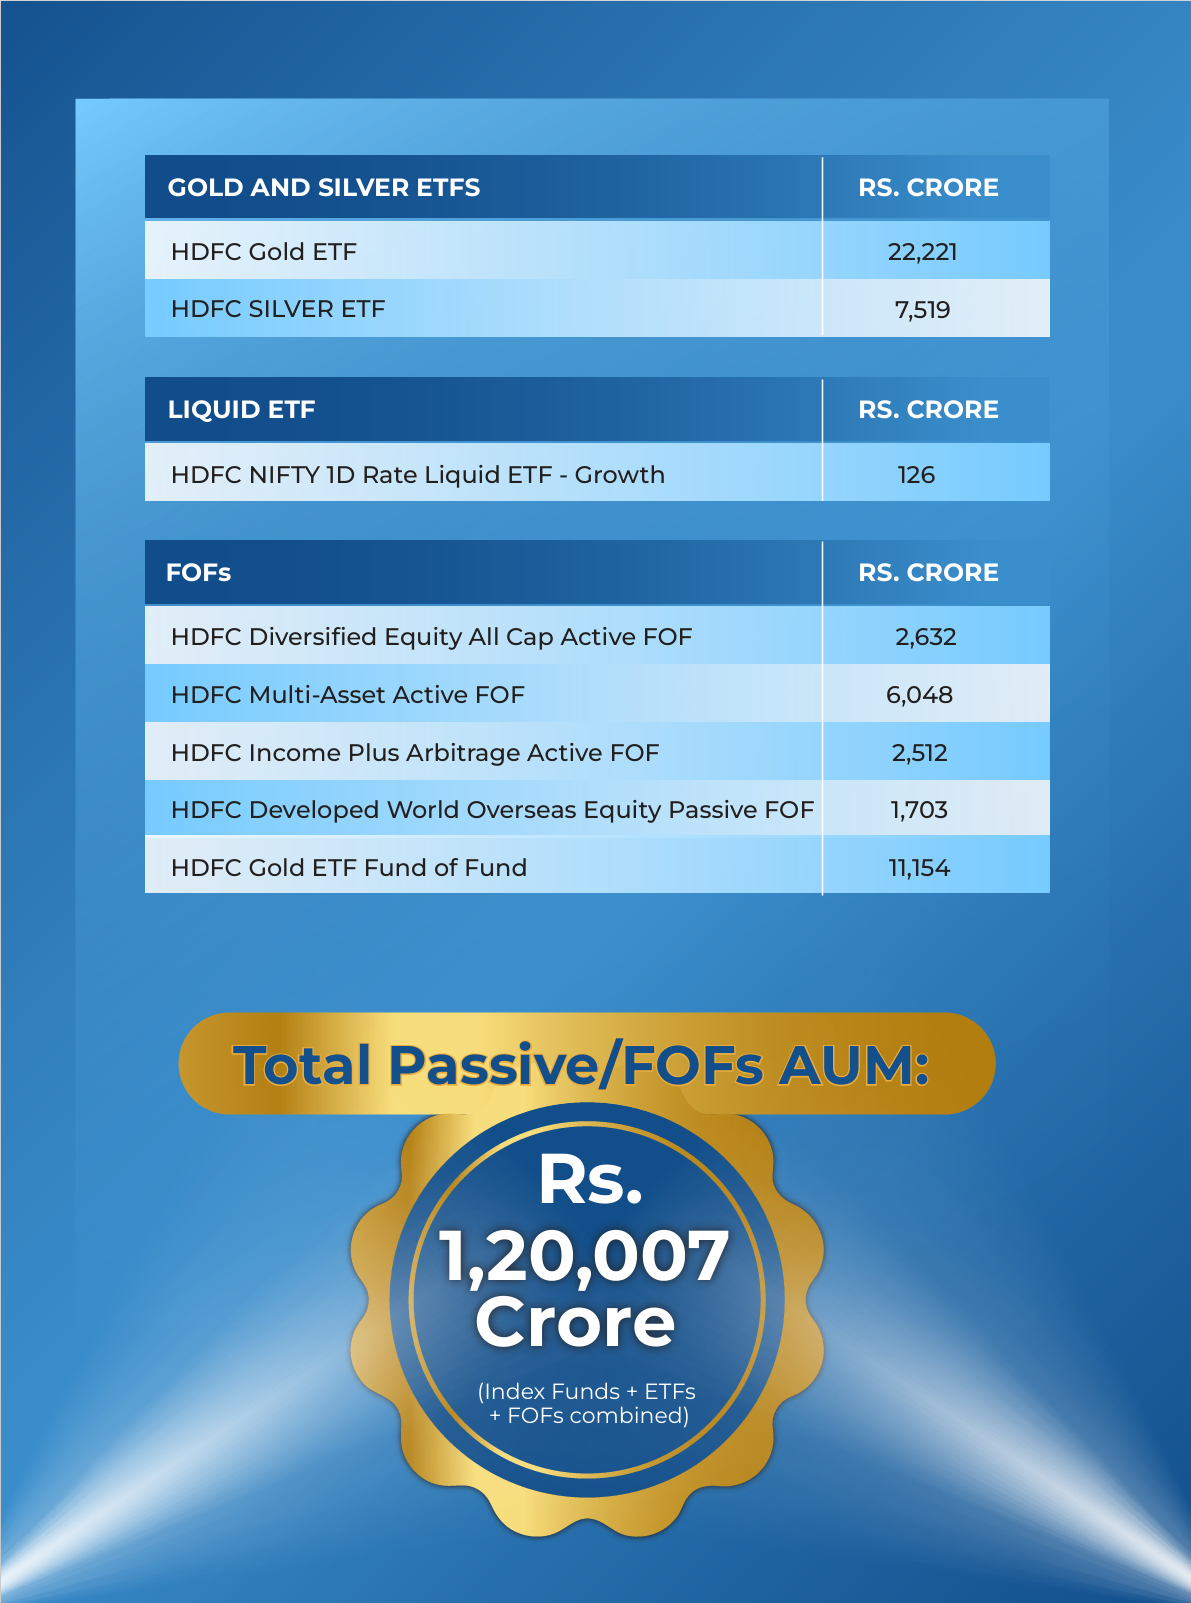
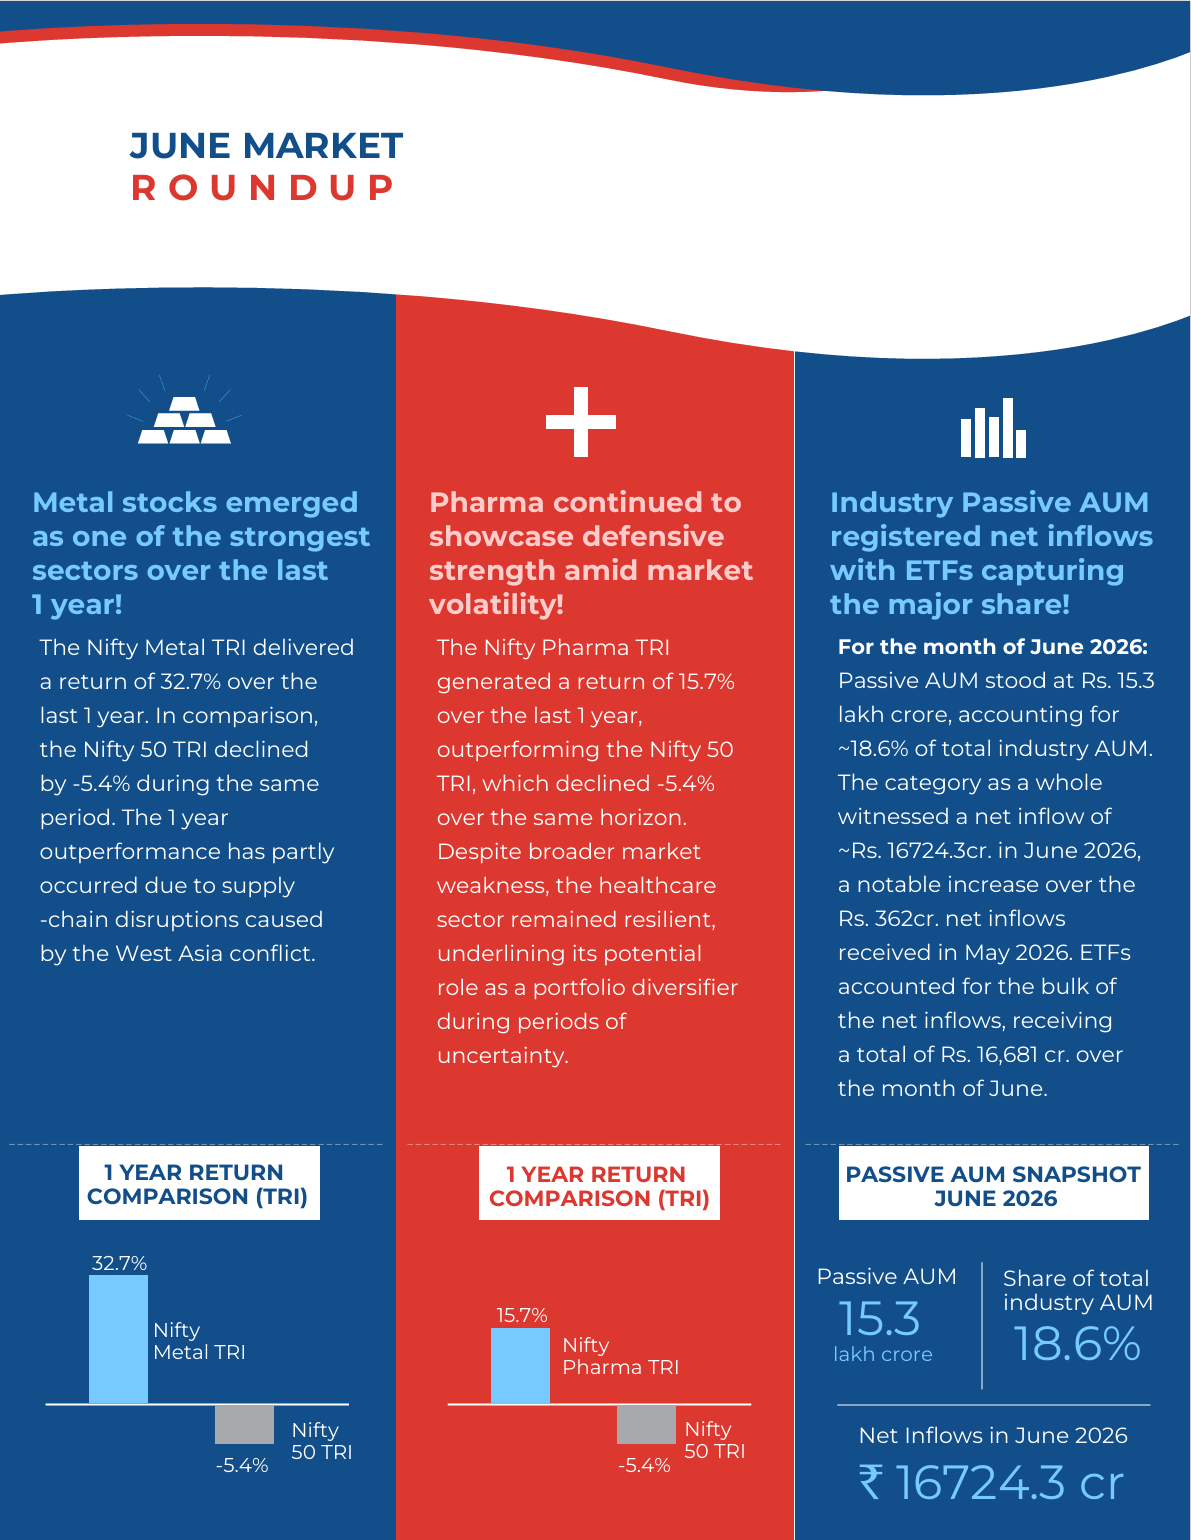
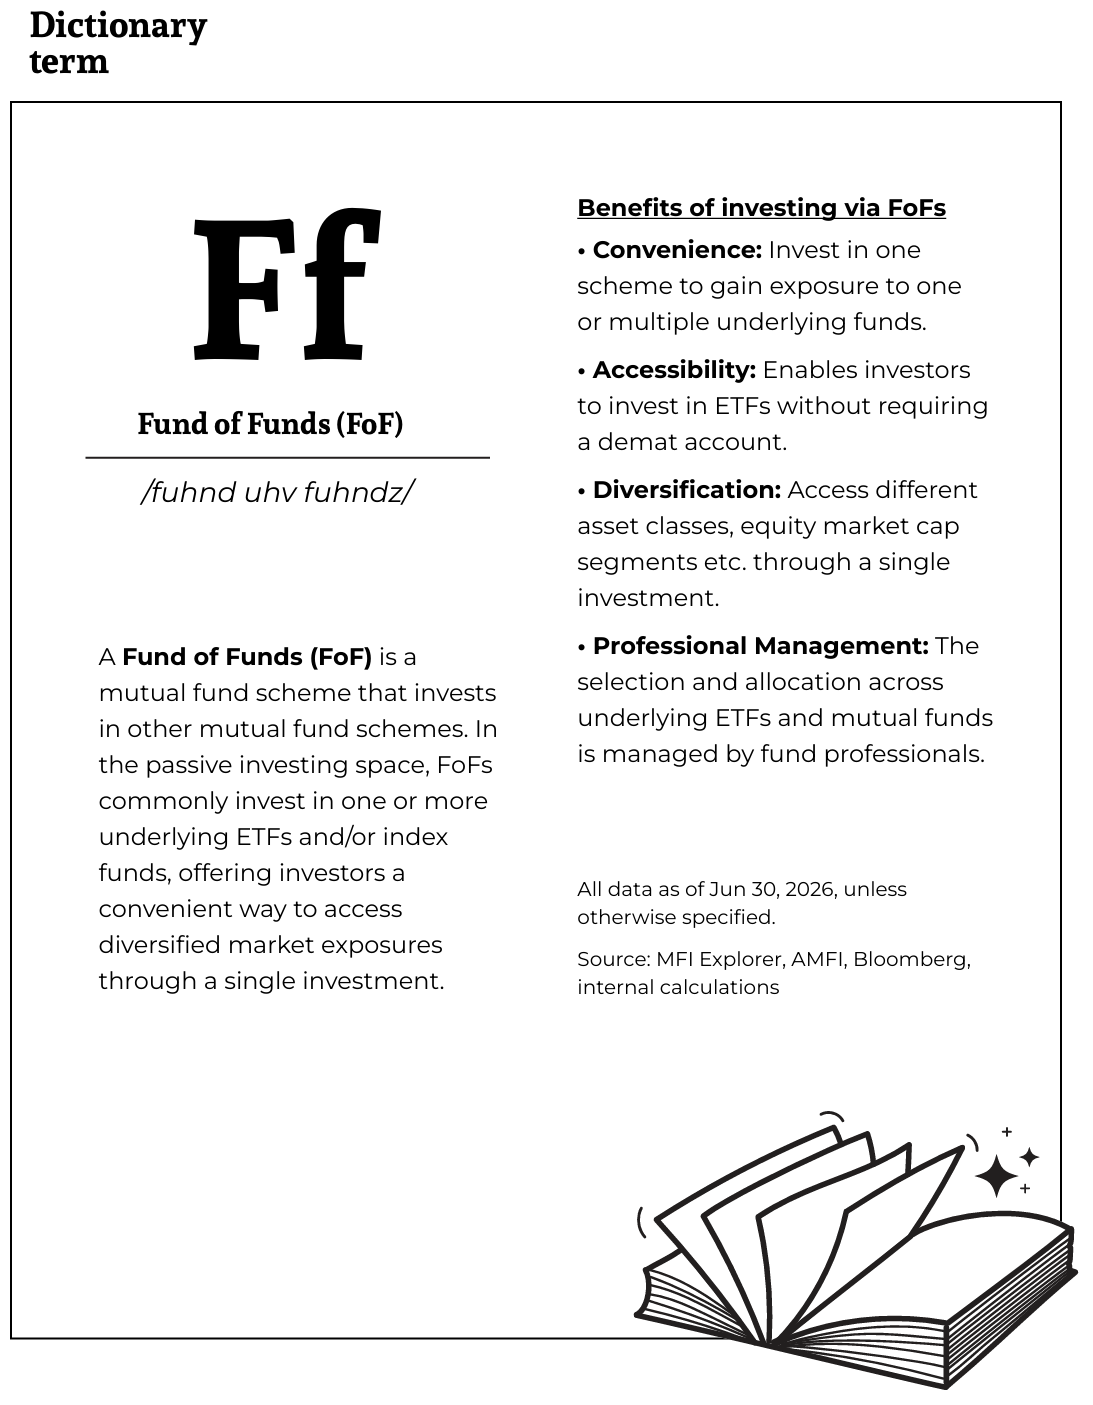
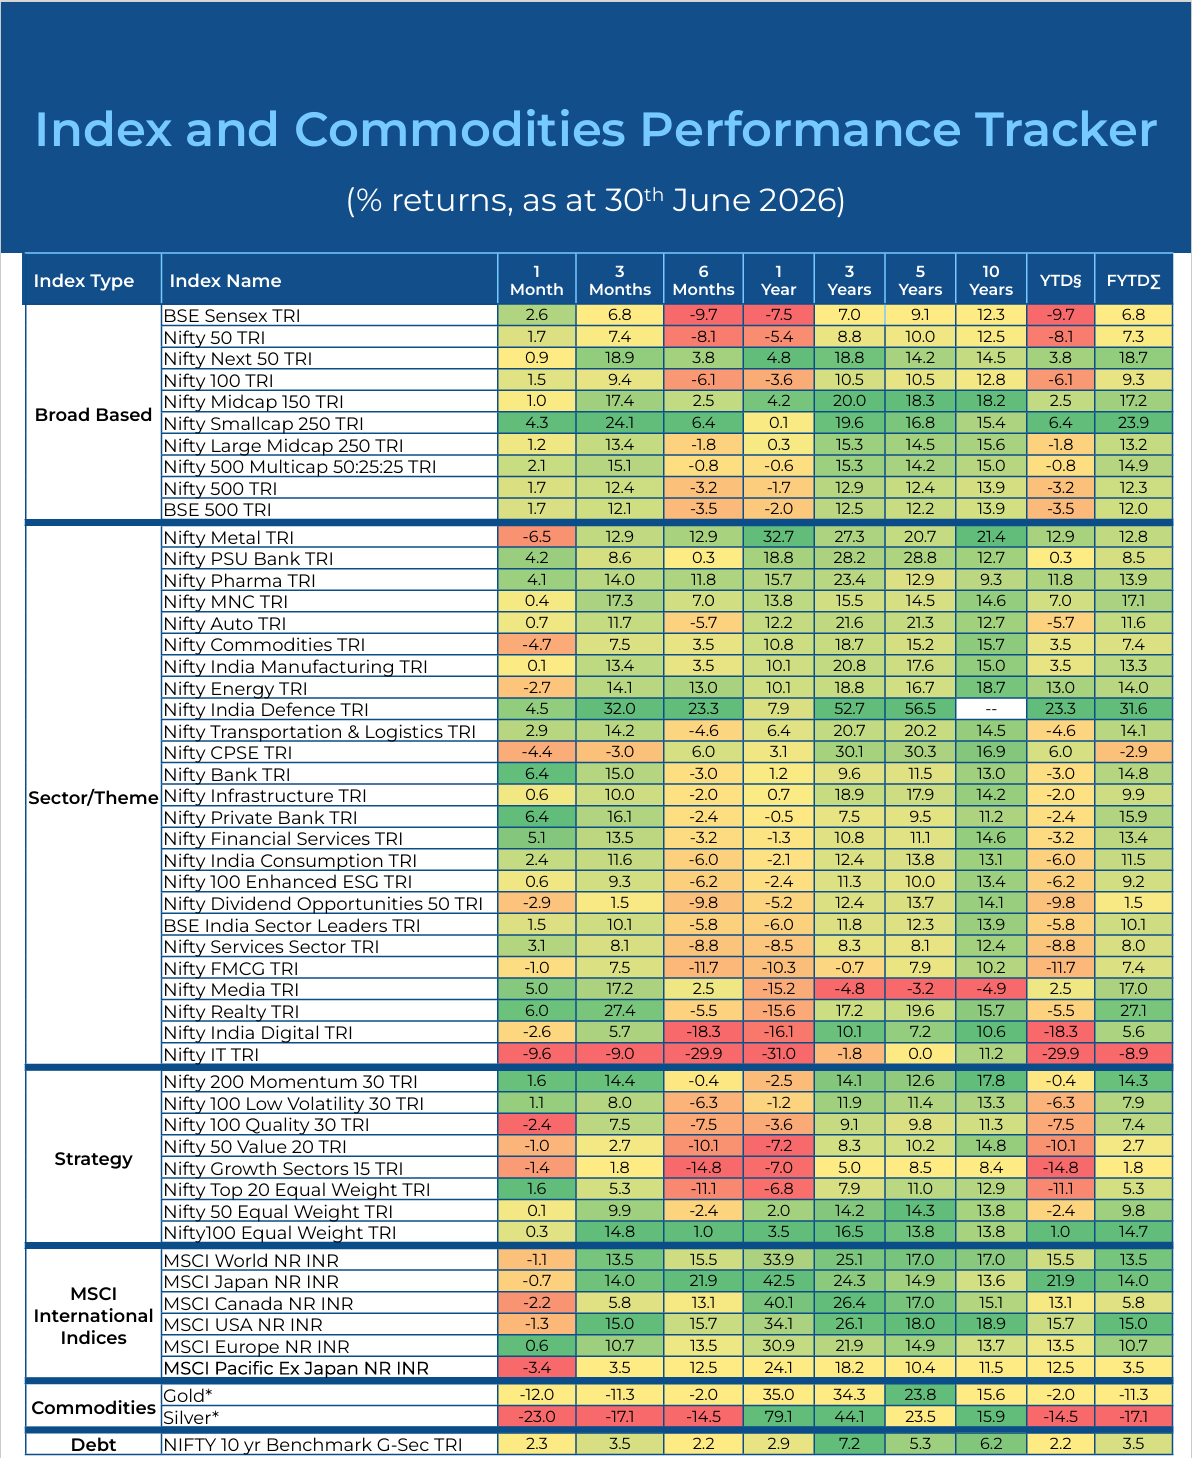
Source: MFI360 Explorer, Morningstar, Bloomberg, internal calculations. Past performance may or may not be sustained in future and is not a guarantee of any future returns.
Disclaimer: The data/statistics is given for general information purposes only and is not an investment advice. Neither HDFC AMC / HDFC Mutual Fund nor any person connected with them, accept any liability arising from the use of this document. The recipient(s) before acting on any information herein should make his/her/their own investigation and seek appropriate professional advice. *Gold and Silver prices in INR do not include any customs duties, local taxes etc. Returns less than 1 year period are simple and greater than 1 year period are compounded annualized (CAGR). § Year to date. ∑ Financial year to date
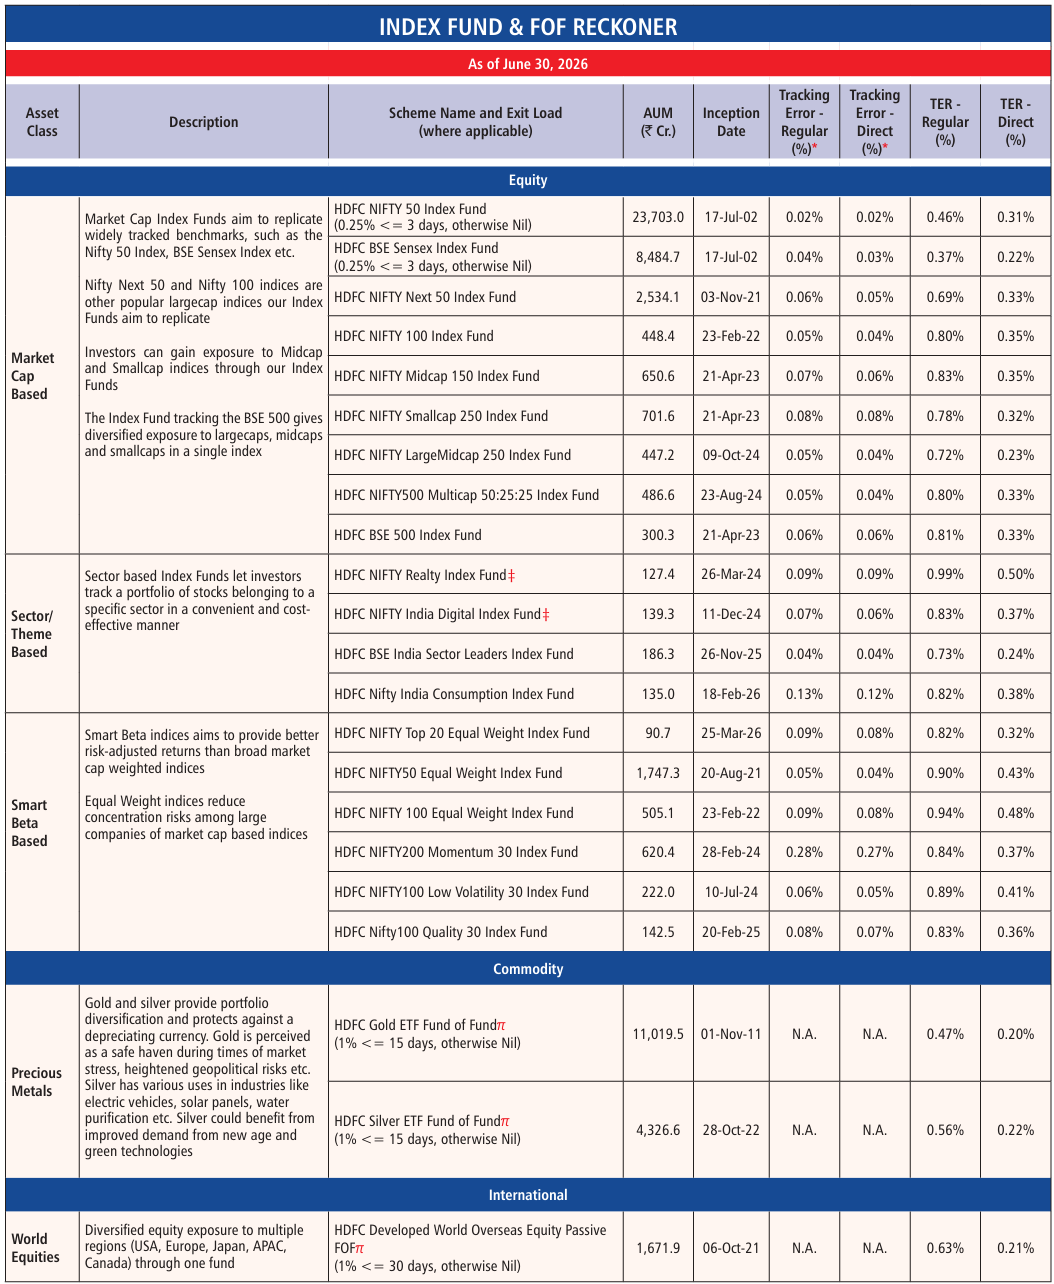
Source: www.hdfcfund.com N.A. - Not Available. TER - Total Expense Ratio (As at last day of the month). Including Additional Expenses and Goods and Service Tax on Management Fees * Annualised tracking error is calculated based on daily returns for the last 12 months ^Investors in the Scheme shall bear the recurring expenses of the Scheme in addition to the expenses of other schemes in which this Fund of Funds scheme makes investment (subject to regulatory limits)
Disclaimer : The information/data herein alone are not sufficient and should not be used for the development or implementation of an investment strategy. The recipient(s) before acting on any information herein should make his/her/their own investigation and seek appropriate professional advice and shall alone be fully responsible/liable for any decision taken on the basis of information contained herein.
NSE Disclaimer: The above mentioned Schemes offered by HDFC Asset Management Company Limited (HDFC AMC) having benchmark as NSE Indices are not sponsored, endorsed, sold or promoted by NSE INDICES LIMITED (formerly known as India Index Services & Products Limited (IISL)). NSE INDICES LIMITED does not make any representation or warranty, express or implied (including warranties of merchantability or fitness for perticular purpose or use) and disclaims all liabilty to the owners of the Products or any member of public regarding the advisability of investing in security generally or in the Products linked to the respective underlying indices of NSE to track general stock market performance in India. Please read the full Disclaimers in the Offer Document of the Products.
BSE Disclaimer: The above mentioned schemes of HDFC AMC having benchmark as BSE Indices are based on the underlying indices of BSE. BSE® and SENSEX® are registered trademarks of BSE Limited. The Schemes is not sponsored, endorsed marketed or promoted by BSE or their respective affiliates. Please refer to the Schemes Information Document for disclaimers.
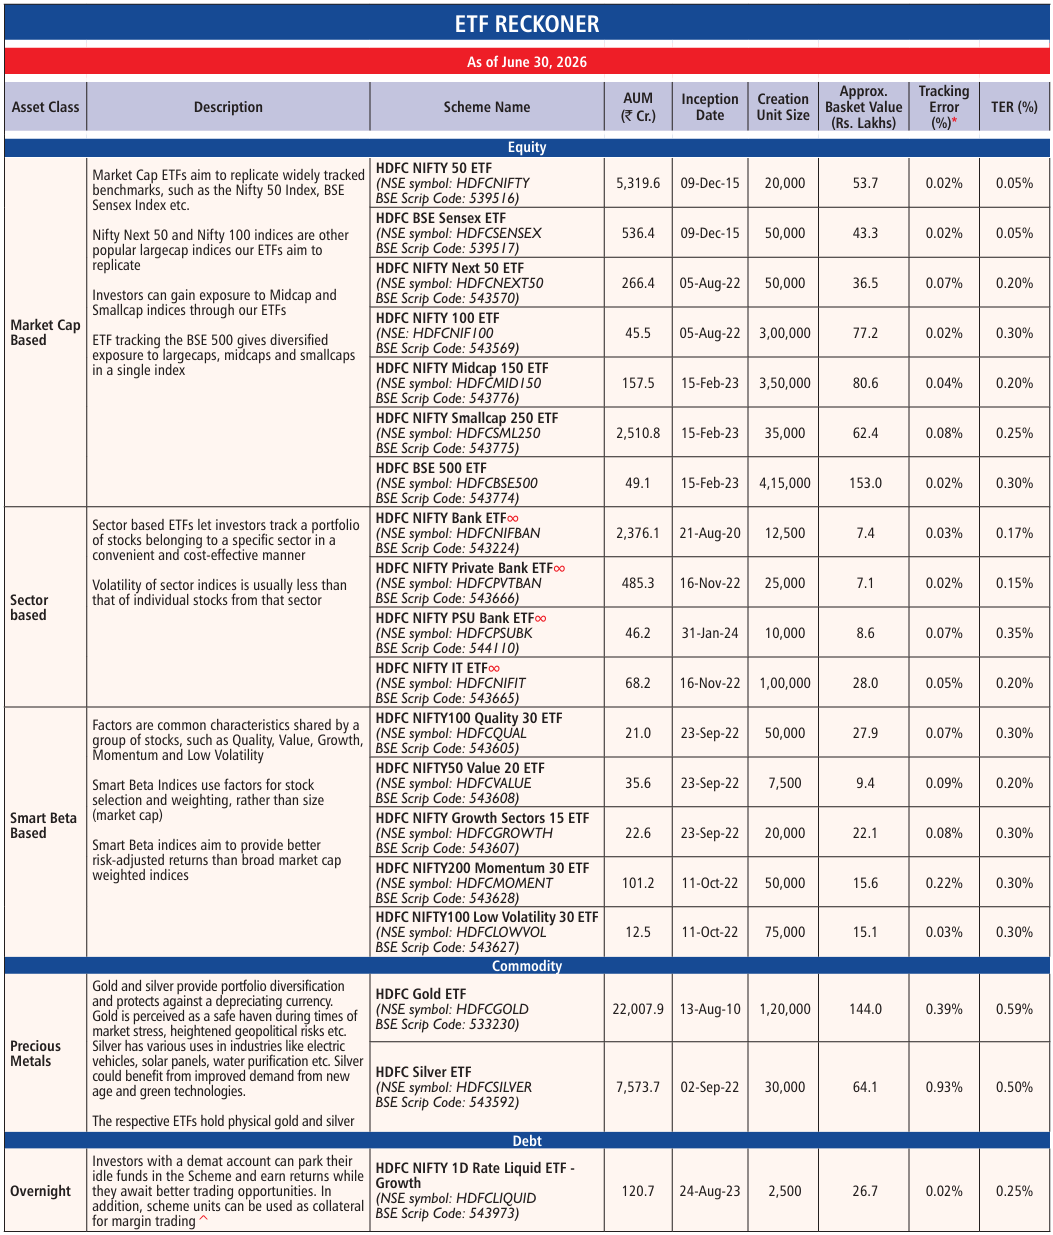
Source: www.hdfcfund.com
N.A. - Not Available. TER -Total Expense Ratio (As at last day of the month). Including Additional Expenses and Goods and Service Tax on Management Fees.
∞ The Schemes being an Exchange Traded Fund investing in a specific sector carries higher risks versus diversified equity mutual funds on account of concentration and sector specific risk. * Annualised tracking error is calculated based on daily returns for the last 12 months. And for schemes that have completed less than 12 months, Annualised Standard Deviation (tracking error) has been calculated based on the available data, i.e. since inception. Exit load does not apply on ETFs. ^ Margin available / haircut applied depends on broker.
Disclaimer : The information/data herein alone are not sufficient and should not be used for the development or implementation of an investment strategy. The recipient(s) before acting on any information herein should make his/her/their own investigation and seek appropriate professional advice and shall alone be fully responsible/liable for any decision taken on the basis of information contained herein.
NSE Disclaimer: The above mentioned Schemes offered by HDFC Asset Management Company Limited (HDFC AMC) having benchmark as NSE Indices are not sponsored, endorsed, sold or promoted by NSE INDICES LIMITED (formerly known as India Index Services & Products Limited (IISL)). NSE INDICES LIMITED does not make any representation or warranty, express or implied (including warranties of merchantability or fitness for perticular purpose or use) and disclaims all liabilty to the owners of the Products or any member of public regarding the advisability of investing in security generally or in the Products linked to the respective underlying indices of NSE to track general stock market performance in India. Please read the full Disclaimers in the Offer Document of the Products.
BSE Disclaimer: The above mentioned schemes of HDFC AMC having benchmark as BSE Indices are based on the underlying indices of BSE. BSE® and SENSEX® are registered trademarks of BSE Limited. The Schemes is not sponsored, endorsed marketed or promoted by BSE or their respective affiliates. Please refer to the Schemes Information Document for disclaimers.
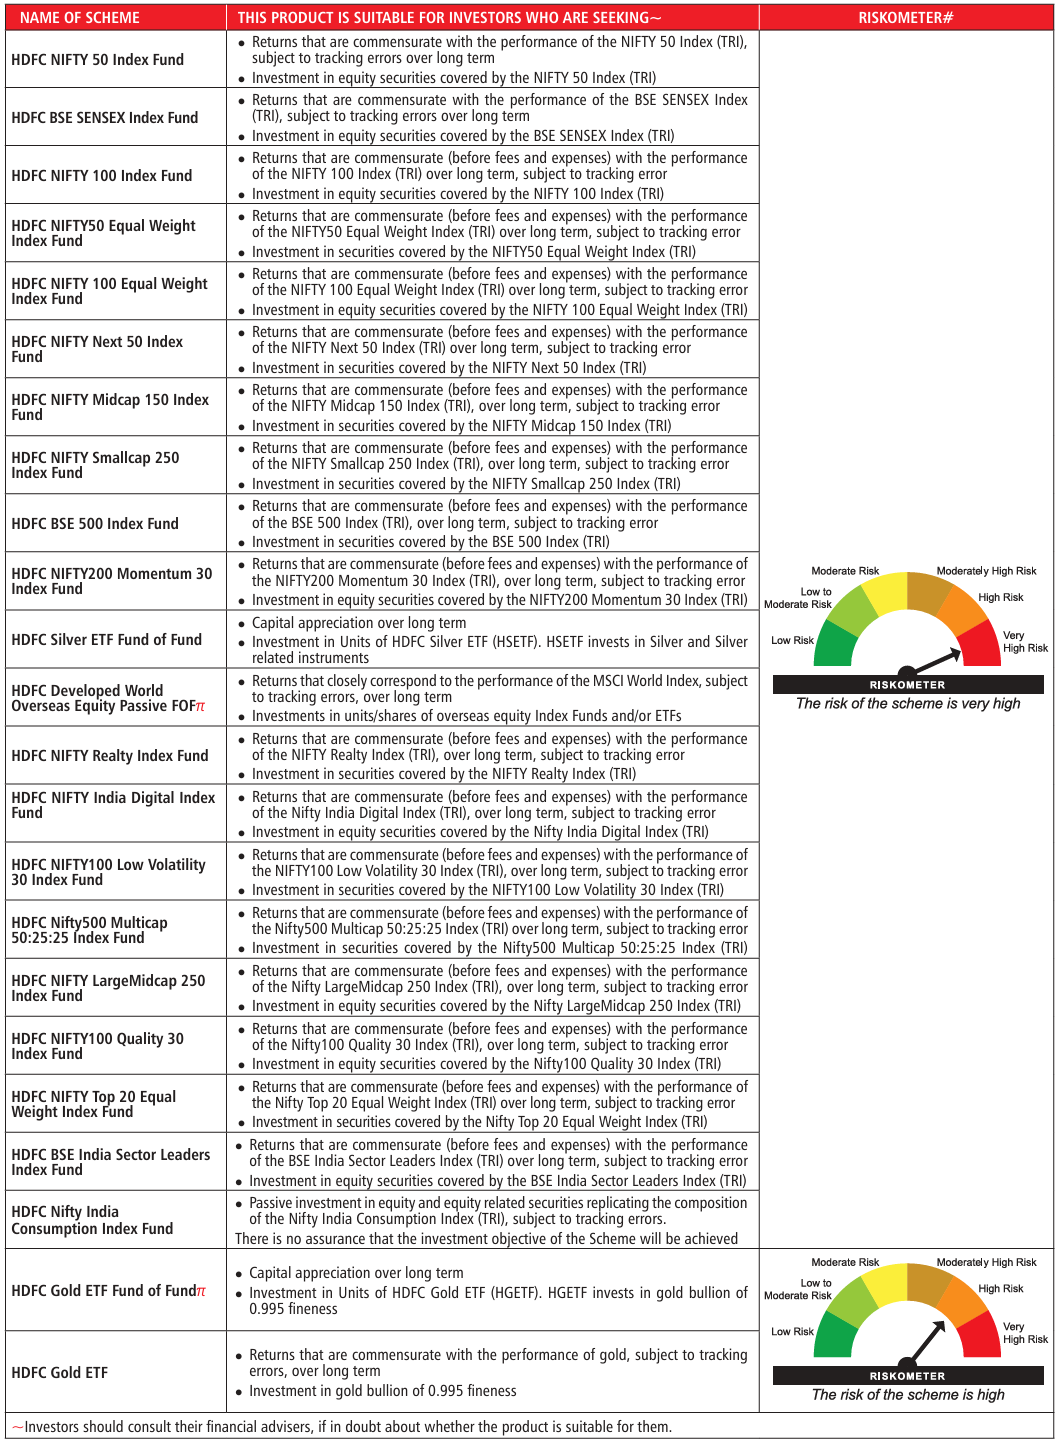
Riskometer as on June 30, 2026. #For latest riskometer, investors may refer to the Monthly Portfolios disclosed on the website of the Fund viz. www.hdfcfund.com
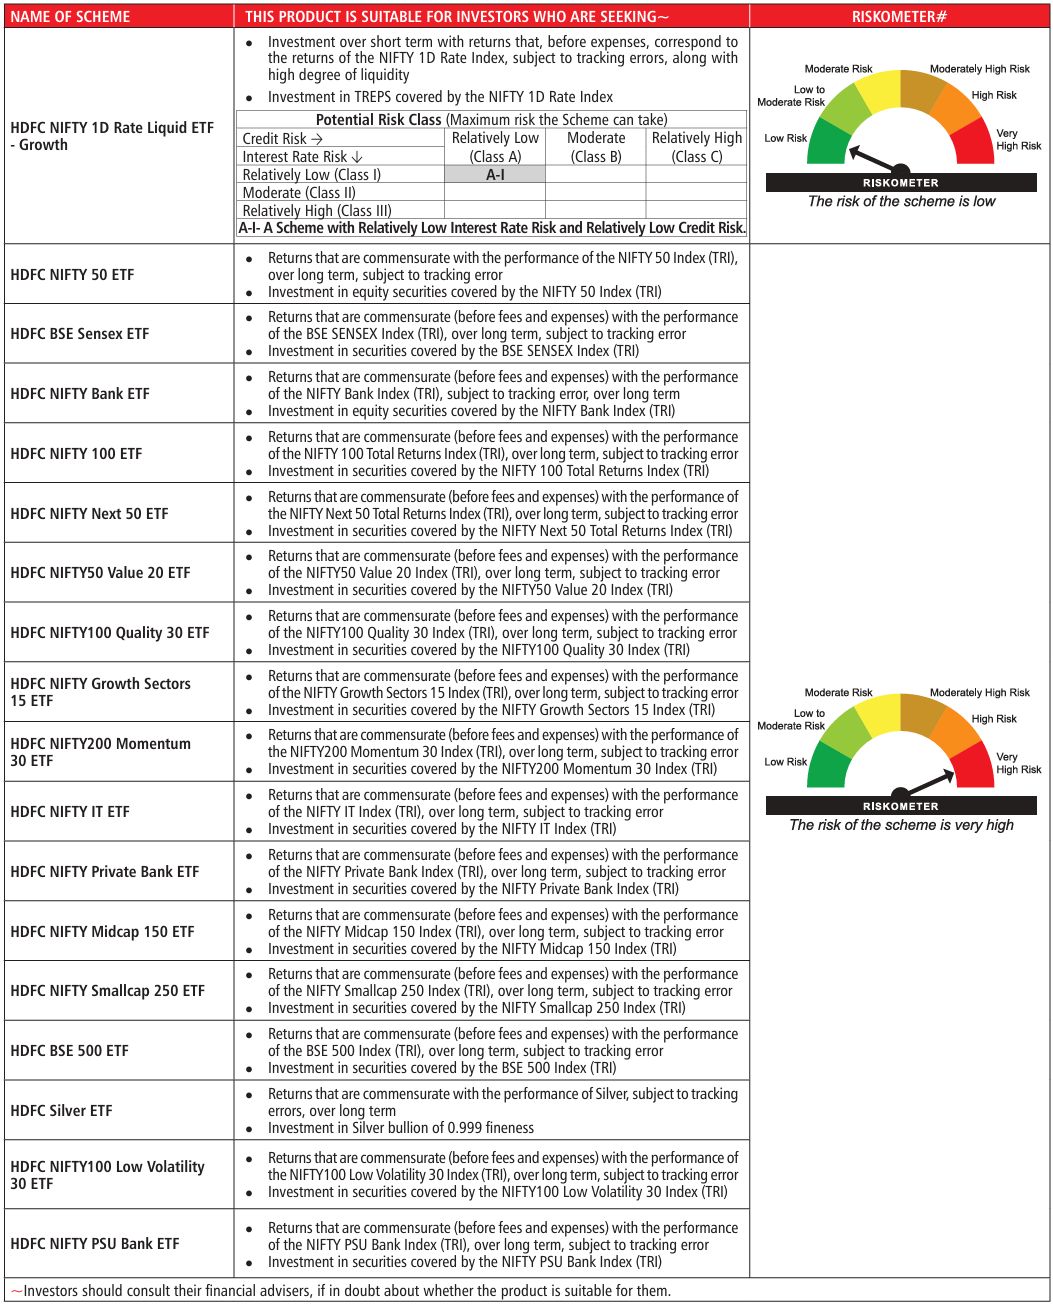
Riskometer as on June 30, 2026. #For latest riskometer, investors may refer to the Monthly Portfolios disclosed on the website of the Fund viz. www.hdfcfund.com
πInvestors in the Scheme shall bear the recurring expenses of the Scheme in addition to the expenses of other schemes in which this Fund of Fund scheme makes investment (subject to regulatory limits).
NSE Disclaimer: The above mentioned Schemes offered by HDFC Asset Management Company Limited (HDFC AMC) having benchmark as NSE Indices are not sponsored, endorsed, sold or promoted by NSE INDICES LIMITED (formerly known as India Index Services & Products Limited (IISL)). NSE INDICES LIMITED does not make any representation or warranty, express or implied (including warranties of merchantability or fitness for particular purpose or use) and disclaims all liability to the owners of the Products or any member of the public regarding the advisability of investing in securities generally or in the Products linked to the respective underlying indices of NSE to track general stock market performance in India. Please read the full Disclaimers in the Offer Document of the Products.
BSE Disclaimer: The above mentioned schemes of HDFC AMC having benchmark as BSE Indices are based on the underlying indices of BSE. BSE® and SENSEX® are registered trademarks of BSE Limited. The Schemes is not sponsored, endorsed marketed or promoted by BSE or their respective affiliates. Please refer to the Scheme Information Document for disclaimers.
MSCI Disclaimer: HDFC Developed World Overseas Equity Passive FOF is not sponsored, endorsed, sold or promoted by MSCI. All MSCI indexes are owned by MSCI and provided as-is without any warranties. MSCI assumes no liability for or in connection with the MSCI indexes. Please refer the Scheme Information Document for complete disclaimer.
CRISIL Disclaimer and Copyright Notice : “© CRISIL Limited. All Rights Reserved Each CRISIL Index (including, for the avoidance of doubt, its values and constituents) is the sole property of CRISIL Limited (CRISIL). No CRISIL Index may be copied, retransmitted or redistributed in any manner. While CRISIL uses reasonable care in computing the CRISIL Indices and bases its calculation on data that it considers reliable, CRISIL does not warrant that any CRISIL Index is error-free, complete, adequate or without faults. Anyone accessing and/or using any part of the CRISIL Indices does so subject to the condition that: (a) CRISIL is not responsible for any errors, omissions or faults with respect to any CRISIL Index or for the results obtained from the use of any CRISIL Index; (b) CRISIL does not accept any liability (and expressly excludes all liability) arising from or relating to their use of any part of CRISIL Indices.
The views are based on internal data, publicly available information and other sources believed to be reliable. The statements contained herein are based on our current views and involve known and unknown risks and uncertainties that could cause actual results, performance or events to differ materially from those expressed or implied in such statements. Stocks/Sectors referred are illustrative and not recommended by HDFC Mutual Fund (“the Fund”)/ HDFC AMC. The Schemes of the Fund may or may not have any present or future positions in these sectors. It should not be construed as an investment advice or a research report or a recommendation by the Fund/HDFC AMC to buy or sell the stock or any other security covered under the respective sector/s. The Fund/ HDFCAMC is not guaranteeing any returns on investments made in the Scheme(s). Past performance may or may not be sustained in future and is not a guarantee of any future returns. HDFC Asset Management Company Limited (“HDFC AMC”) does not warrant the completeness or accuracy of the information herein. Neither HDFC AMC, nor any person connected with it, accepts any liability arising from the use of this material. The recipient(s) should before taking any decision, should make their own investigation and seek appropriate professional advice.
MUTUAL FUND INVESTMENTS ARE SUBJECT TO MARKET RISKS, READ ALL SCHEME RELATED DOCUMENTS CAREFULLY.
Receive Index Insider every month for insights shaping the passive investing world
Did you find this interesting?
Your opinion matters - share your thoughts and help us improve.