
- Entering text into the form field will trigger a list of options
Trending Searches
- Invest / Login
The Cost of "I'll Start Next Month"

Last Updated On: 22 Aug 2026

It is a common human tendency to plan on starting something "soon" than "right away". This applies to investing too. "Let the bonus come in." "Let the EMI get over." "Let this month settle down, I'll start my SIP next month." We say these lines with confidence, believing the right moment is just around the corner.
It sounds perfectly sensible in the moment, but it's quietly one of the most expensive lines in personal finance. Because when you delay that first investment by 30 days, you're not just losing a month, you're losing every day of compounding that would've started with it.
Why We Delay our Investments?
Delaying investments isn't usually about discipline - it's shaped by our natural behavioural biases. Behavioural economists call this present bias, our natural tendency to prioritize today's comfort over tomorrow's benefit, even when we know the future matters more.
These are the most common forms that delay tends to take:
The Perfect Moment Myth
Waiting for the "right" time to enter the market.
The Round Number Trap
Waiting to invest ₹10,000 instead of starting with 2,000 today.
The Clarity Excuse
Waiting to "understand mutual funds properly" before starting.
Why We Delay our Investments?
The sooner you start, makes a lot of difference!
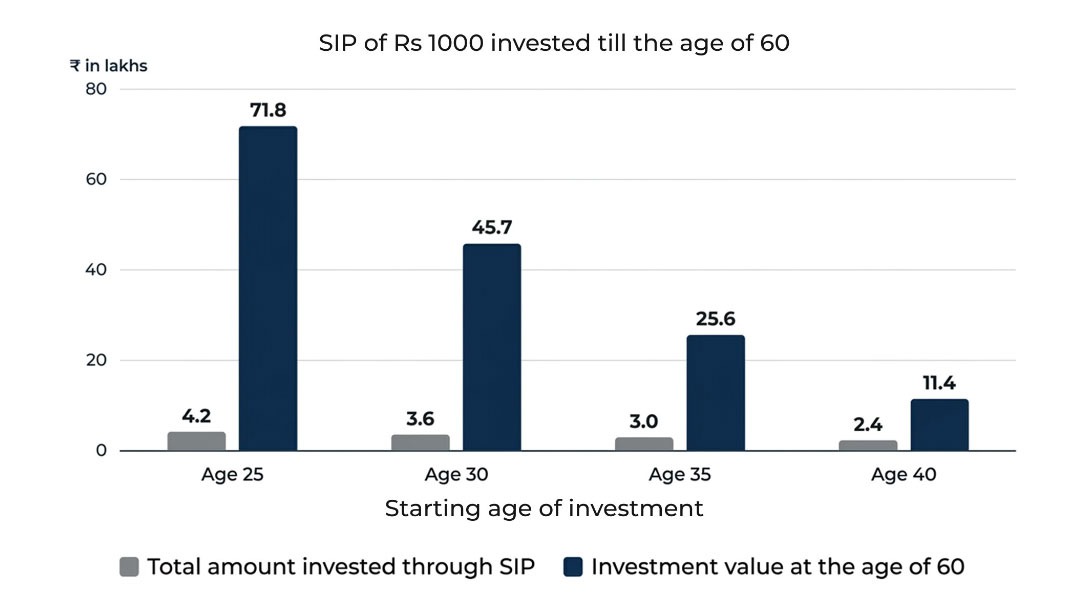
Source: MFI 360. Past performance may or may not be sustained in future and is not a guarantee of any future returns. Data as on 31st July 2026, the rate of return is calculated using an SIP amount of Rs 1000 invested in Nifty 50 TRI at the beginning of every month for a period of 35 years, 30 years, 25 years and 20 years till 31st July 2026. Performance is calculated using Nifty 50 TRI values, as Nifty 50 TRI data is not available before July 1999, performance is calculated using Nifty 50 PRI values till June 1999 and TRI values since July 1999. The above calculations are based on actual returns of NIFTY 50 Index to explain the power of compounding and should not be construed as a promise of minimum returns and safeguard of capital.
Time Is the One Input You Can't Buy Back
Every other input in investing - the amount, the fund, the asset mix, can be adjusted later. You can top up your SIP next year. You can switch funds. You can rebalance. The one thing you can never retroactively add is time already gone.
So, What Actually Helps?
The solution to this is not to push harder but to begin with something simple enough to stick.
Start before you feel "ready."
A small SIP started today could posiblibly beat a large one planned for "someday."
Automate your SIP's.
Let the SIP debit happen before you have the chance to talk yourself out of it.
Pick a horizon-appropriate fund, then let time do the work.
For long-term goals, well-diversified equity categories, like a flexi cap fund that could move across large, mid and small caps as opportunities shift are built precisely to be held through market cycles, not timed around them.
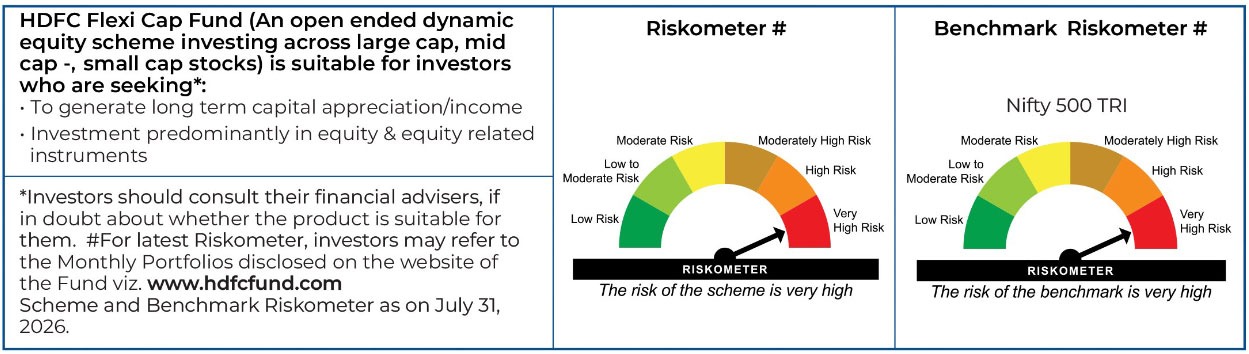
When reviewing long-term SIP options, funds with long operating histories could offer useful perspective on how they've moved through different market conditions. For example, HDFC Flexi Cap Fund, launched in January 1995, is one such fund with a multi-decade record available for analysis. A monthly SIP of Rs 10,000@ in HDFC Flexi Cap Fund since its inception has bloomed into Rs 21.60^ Crore
SIP - Systematic Investment Plan
Assuming 10,000, invested systematically since inception from 01 january 1995, on the first business day of every month over a period of time. As on July 31st 2026. For complete performance in SEBI prescribed format.

A. SIP Performance^ - Regular Plan - Growth Option
| Lorem Ipsum | Since Inception* | 15 year SIP | 10 year SIP | 5 year SIP | 3 year SIP | 1 year SIP |
|---|---|---|---|---|---|---|
| Total Amount Invested (₹ in lacs) | 37.90 | 18.00 | 12.00 | 6.00 | 3.60 | 1.20 |
| Market Value as on July 31, 2026 (₹ in lacs) | 2,260.28 | 67.28 | 29.27 | 8.90 | 4.21 | 1.24 |
| Returns (%) | 20.34 | 16.00 | 16.99 | 15.78 | 10.39 | 5.86 |
| Benchmark Returns (%)# | 14.61 | 13.94 | 13.90 | 11.21 | 7.32 | 5.89 |
| Additional Benchmark Returns (%)## | 13.21 | 12.31 | 11.97 | 8.16 | 4.39 | -0.61 |
Assuming 10,000 invested systematically on the first Business Day of every month over a period of time. CAGR returns are computed after accounting for the cash flow by using XIRR method (investment internal rate of return) for Regular Plan - Growth Option. The above investment simulation is for illustrative purposes only and should not be construed as a promise on minimum returns and safeguard of capital. SIP - Systematic Investment Plan.
B. Performance^ - Regular Plan - Growth Option
NAV as on July 31, 2026: 2,059.826 (per unit)
| Period | Scheme Returns (%) | Benchmark Returns (%)# | Additional Benchmark Returns (%)## | Value of investment of (₹) 10,000 | ||
|---|---|---|---|---|---|---|
| Scheme (₹) | Benchmark (₹)# | Additional Benchmark (₹)## | ||||
| Last 1 Year | 4.60 | 3.37 | -0.43 | 10,460 | 10,337 | 9,957 |
| Last 3 Years | 16.27 | 12.29 | 8.56 | 15,725 | 14,163 | 12,798 |
| Last 5 Years | 17.99 | 12.53 | 10.39 | 22,886 | 18,055 | 16,405 |
| Last 10 Years | 15.54 | 13.55 | 12.27 | 42,476 | 35,688 | 31,857 |
| Since Inception* | 18.36 | 12.17 | 11.31 | 2,059,826 | 376,921 | 295,853 |
Common notes for above table A & B: ^Past performance may or may not be sustained in future and is not a guarantee of any future returns. "Inception Date: January 01, 1995. The scheme is managed by Mr. Amit Ganatra since February 01, 2026. # Nifty 500 TRI. ## Nifty 50 TRI. The expenses of the Direct Plan under the Scheme will be lower to the extent of the distribution expenses / commission charged in the Regular Plan. As NIFTY 50 TRI data is not available since inception of the scheme, additional benchmark performance is calculated using composite CAGR of NIFTY 50 PRI values from January 1, 1995 to June 29, 1999 and TRI values since June 30, 1999. Load is not taken into consideration for computation of performance. Returns greater than 1 year period are compounded annualized (CAGR). Returns as on July 31, 2026.
For performance of other funds managed by fund manager, Please click here.
Views expressed above are indicative and should not be construed as investment advice or as a substitute for financial planning. Due to the personal nature of investments, investors are advised to seek professional advice before investing.
MUTUAL FUND INVESTMENTS ARE SUBJECT TO MARKET RISKS, READ ALL SCHEME RELATED DOCUMENTS CAREFULLY.
Stay ahead with our insights
Did you find this interesting?
Your opinion matters - share your thoughts and help us improve.