- Entering text into the form field will trigger a list of options
Trending Searches
- Invest / Login
Test Match Investing in a T20 World

Last Updated On: 16 Aug 2026
Building an innings takes time

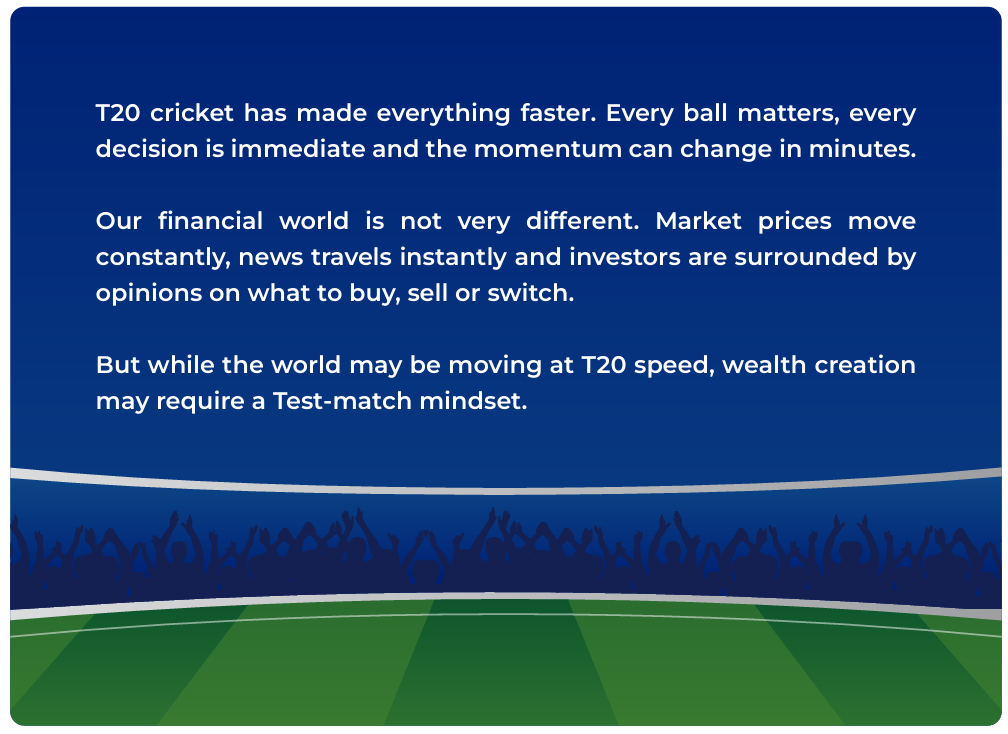
A Test batsman knows that a long innings is not built by hitting every ball for a boundary.
Some balls are left alone. Some are defended. And when the right opportunity comes, the batsman scores.
Investing can be approached in much the same way.
Markets will go through periods of optimism, uncertainty and volatility. Trying to react to every movement can make investing an emotional exercise.
A long-term investor, instead, can focus on the objective, investment horizon and risk appetite, and allow the investment strategy time to play out.
How Steady Batting Mirrors Steady Investing

A Systematic Investment Plan (SIP) can bring a similar discipline to investing.
By investing a fixed amount at regular intervals, investors can continue investing through different market conditions instead of trying to identify the perfect time to enter the market.
When markets are lower, the same investment amount can purchase more units; when markets are higher, it can purchase fewer units.
Over a long period, this disciplined approach can help investors remain focused on their investment journey rather than reacting to every market movement.
The objective isn't to predict every ball. It is to keep batting.

How Steady Batting Mirrors Steady Investing

Investing can be similar. Compounding works over time, and the benefits of staying invested may become more meaningful over longer periods.
To understand this better, consider two investors playing very different innings.

Person A invests ₹10,000 per month through SIP for 10 years* in the HDFC Value Fund^.
- Total Investment Amount = ₹12 lakhs,
- Investment Value (as of 31st July 2026) = ₹26 lakhs

Person B, on the other hand, tries to “accelerate the scoring” by doubling the monthly amount to ₹20,000, but invests for 5 years** in the HDFC Value Fund^.
- Total Investment Amount = ₹12 lakhs
- Investment Value (as of 31st July 2026) = ₹17.19 lakhs
Even though the total investment is the same ₹12 lakh, the shorter investment horizon means less time in the market, resulting in a difference of almost ₹8.8 lakhs.
*01 Aug 2016 – 01 July 2026, **01 Aug 2021 – 01 July 2026, ^Regular – Growth plan considered
Source: MFI360 Explorer
The example illustrates an important lesson: a long innings gives an investment more time to potentially grow.
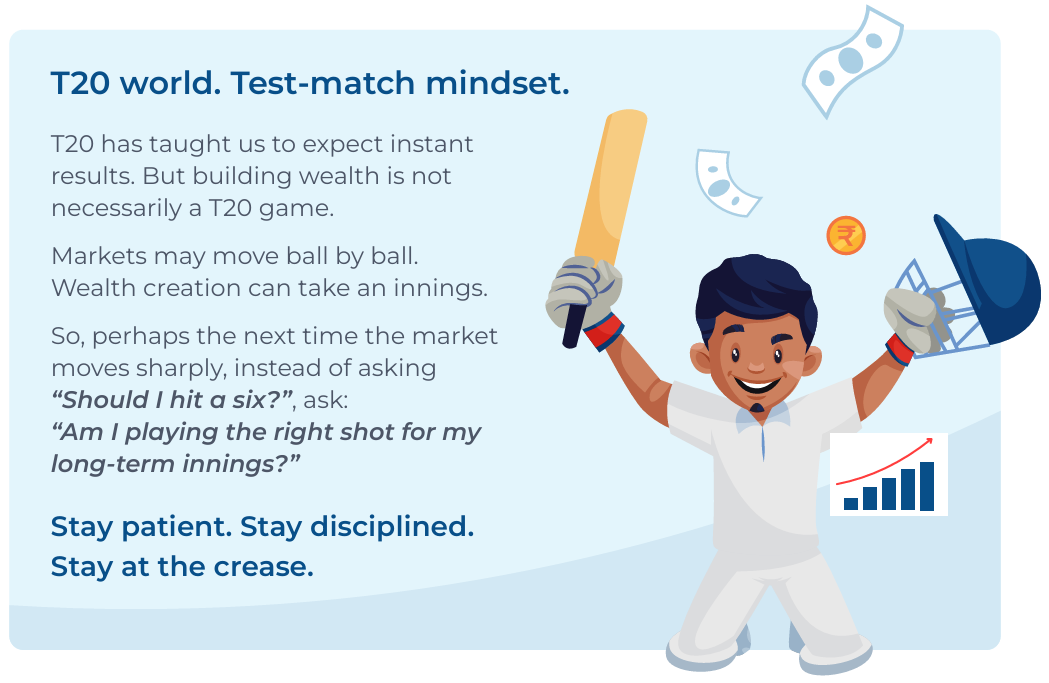
Stay at the crease

Similarly, an investor's journey can have market rallies, corrections and periods of uncertainty.
Instead of reacting to every short-term movement, investors could consider:

Know your goal
Invest according to your financial objective and investment horizon.

Know your risk appetite
Choose an investment approach that is aligned with your ability and willingness to take risk.

Stay disciplined
Avoid allowing short-term market movements to repeatedly change a long-term investment plan.
HDFC Value Fund
A. SIP Performance - Regular Plan - Growth Option

Assuming ₹10,000 invested systematically on the first Business Day of every month over a period of time. CAGR returns are computed after accounting for the cash flow by using XIRR method (investment internal rate of return) for Regular Plan - Growth Option. The above investment simulation is for illustrative purposes only and should not be construed as a promise on minimum returns and safeguard of capital. SIP - Systematic Investment Plan.
B. Performance - Regular Plan - Growth Option
NAV as on July 31, 2026 ₹788.576 (per unit)
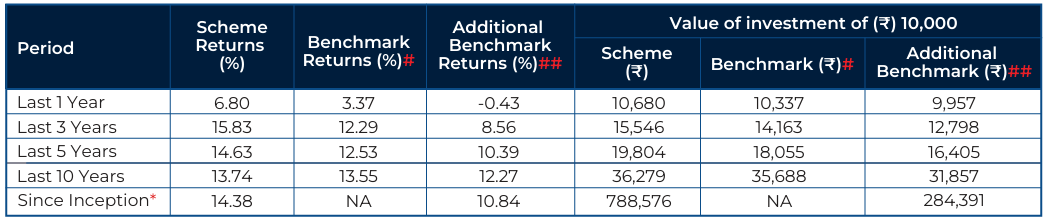
Common notes for above table A & B: Past performance may or may not be sustained in future and is not a guarantee of any future returns. *Inception Date: February 01, 1994. The scheme is managed by Mr. Anand Laddha since February 01, 2024. # Nifty 500 TRI. ## Nifty 50 TRI. The expenses of the Direct Plan under the Scheme will be lower to the extent of the distribution expenses / commission charged in the Regular Plan. As NIFTY 50 TRI data is not available since inception of the scheme, additional benchmark performance is calculated using composite CAGR of NIFTY 50 PRI values from February 1, 1994 to June 29, 1999 and TRI values since June 30, 1999. Load is not taken into consideration for computation of performance. Returns greater than 1 year period are compounded annualized (CAGR). N.A.: Not Available. Returns as on July 31, 2026.
For performance of other funds managed by fund manager, Please click here.
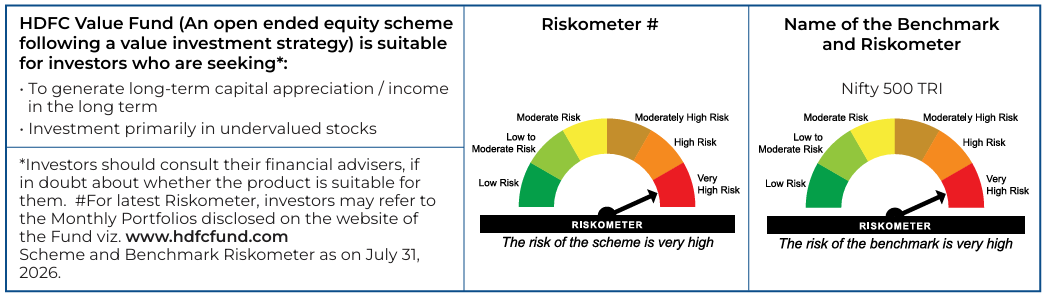
Views expressed above are indicative and should not be construed as investment advice or as a substitute for financial planning.
Due to the personal nature of investments, investors are advised to seek professional advice before investing.
MUTUAL FUND INVESTMENTS ARE SUBJECT TO MARKET RISKS, READ ALL SCHEME RELATED DOCUMENTS CAREFULLY.
Stay ahead with our insights
Did you find this interesting?
Your opinion matters - share your thoughts and help us improve.