Two Sides of the Coin – INR’s Challenges and India's Enduring Strengths
Last Updated On: 15 Apr 2026
5 min read
Whats the Point?
- The Indian Rupee (INR) has depreciated by 10.96% against the US Dollar (USD) in FY26, briefly breaching US$95 intraday in March 2026, thus marking its steepest annual decline in 13 Fiscal Years, surpassing the 2013 Taper Tantrum. This fall has been predominantly led by Foreign Portfolio Investors (FPIs) selling US$19.7 billion in FY26 and the spike in crude oil prices as a result of the onset of the US/Israel-Iran conflict in late February 2026.
- Besides direct intervention to support INR, the Reserve Bank of India (RBI), under the Foreign Exchange Management Act (FEMA), 1999, issued a directive on March 27, 2026 to cap the Net Open Position in Indian Rupee (NOP-INR) for all Authorised Dealer Banks at US$100 million in the onshore deliverable market at the close of each business day.
- Despite the pressures on INR, India’s lower inflation places INR’s Real Effective Exchange Rate at 94.05 (February 2026) in an undervalued territory versus its medium to long-term average. In addition to that, India’s Forex Reserves remain healthy at US$697.1 billion as of April 03, 2026.
Key Drivers of Depreciation of INR against USD: The One Side of the Coin
- Rise in Brent Crude Oil Prices: Brent Crude Oil prices surged ~63% from ~US$72/bbl (barrel) on February 27, 2026 to ~US$118/bbl on March 31, 2026, following the onset of the US/Israel-Iran conflict in late February 2026. Given India's high import dependence on energy, every US$10/bbl rise in Crude Oil prices could add ~$18 billion to the import bill (Kotak Institutional Equities) and could put pressure on India’s CAD**. While prices have retreated from their highs, elevated crude oil prices remain a risk to INR strength amidst continued geopolitical uncertainty.
- Foreign Portfolio Investor Outflows: As per National Securities Depository Limited (NSDL), FPIs pulled out over US$19.7 billion from Indian equity markets in FY26, on top of US$14.6 billion in FY25. March 2026 alone saw approximately US$13 billion in equity outflows. INR faced higher pressure in light of the elevated fixed income outflows under the Fully Accessible Route to the tune of US$1.2 billion. Despite Indian equity market valuations standing closer to their long-term averages across market cap segments, outflows of such magnitude reflect global risk-off sentiment rather than just a loss of confidence in India’s fundamentals.
- RBI’s Forward Book Overhang: The dollar deficit (RBI’s net short dollar position in the forward market) in the RBI’s net forward book stood at US$67.8 billion as of January 2026 with estimates suggesting the net forward sales expected to touch nearly US$81 billion by March 2026, as RBI leans on swaps and forwards rather than depleting spot reserves. In the spot market, RBI sold a net US$50.8 billion between end of March 2025 and January 2026 (RBI Bulletin). While such interventions cushioned the fall, they did not stop INR’s depreciation.
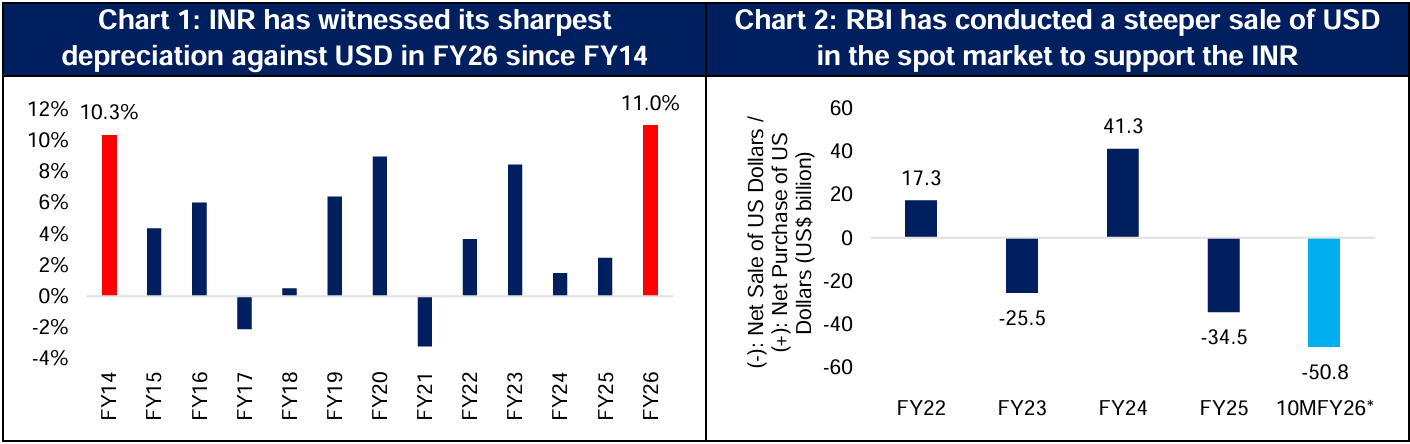
Source: Bloomberg, Centre for Monitoring Indian Economy (CMIE); *10MFY26: April 2025 to January 2026
India’s Enduring Strength: The Other Side of the Coin
- Strong Economic Growth: As per RBI's April 2026 Monetary Policy Statement, India's Real GDP growth is estimated at 7.4% in FY26 (Second Advance Estimates), reaffirming its position as the fastest-growing major economy globally. While elevated energy prices and supply constraints could weigh on domestic production in FY27, growth remains supported by GST rationalisation, robust services sector expansion, and rising capacity utilisation. RBI projects FY27 GDP growth at 6.9% Y-o-Y (compared to 7.6% in FY26).
- Lower Inflation: RBI attributed the January and February 2026 CPI (Consumer Price Index) uptick primarily to base effects, with underlying momentum remaining benign – core inflation (ex-precious metals) averaged just 2.1% in those two months. Near-term risks stem from the ongoing conflict, elevated global energy and commodity price volatility, and potential El Niño conditions. Nevertheless, headline CPI averaged a multi-decadal low of 1.9% for 11MFY26 – a level that preserves real purchasing power and supports broader consumption growth.
- Strong Services Exports and Foreign Direct Investments: India’s services exports grew by 13.6% to US$387.5 billion in FY25, and has continued to expand, standing at US$383.1 billion in 11MFY26 (8.9% Y-o-Y growth over 11MFY25). Gross FDI grew by 14.7% to US$79.3 billion in 10MFY26 compared to the same period a year earlier. This signals long-term investors’ conviction in India’s structural story, even amidst short-term currency volatility.
NOP-INR Cap: Decoding the Directive
A Net Open Position (NOP) is the net unhedged foreign currency exposure a bank carries after offsetting its purchases and sales. Prior to the RBI's directive of March 27, 2026, banks could self-determine NOP limits, subject to a ceiling of 25% of total capital – translating into open positions worth billions of dollars for large private and foreign banks. The new uniform cap of US$100 million replaces this discretion with a centrally mandated threshold, regardless of institution size. RBI's stated objectives are to curb excessive open INR positions, moderate currency fluctuation risks, and support orderly conditions in the foreign exchange market.
Conclusion
Going into FY27, INR’s stability hinges on crude oil prices, FPI equity flows, and US Fed's rate path. Forex Reserves peaked at US$728.5 billion (February 27, 2026) before declining by over US$30 billion to US$697.1 billion by April 03, 2026. Yet, India has the world's 4th largest reserve stock, offering ~11 months of import cover and ~94% external debt coverage. CAD is expected at 0.8% in FY26, but could touch 2% in FY27 should Brent Crude Oil prices remain elevated at US$95/bbl. However, this level is below the 4.8% in FY13, when INR depreciated by a similar magnitude. Structurally, the finalisation of India-US trade deal could ease tariff-related export headwinds and support the INR.
Sources: RBI, Bloomberg, CMIE, KIE, and other publicly available information. [**CAD: Current Account Deficit]
About Tuesday’s Talking Point (TTP): TTP is an effort by HDFC AMC to guide key conversations in the Indian financial markets and investing ecosystem. We aspire to do this by providing relevant facts, along with our perspective on the issue at hand. Please provide your feedback at this link: https://forms.office.com/r/Cr8JNjMGWk
Disclaimer: Views expressed herein are based on information available in publicly accessible media, involve known and unknown risks and uncertainties that could cause actual results, performance, or events to differ materially from those expressed or implied herein. The information herein is for general purposes only. Stocks/Sectors/Views referred are illustrative and should not be construed as an investment advice or a research report or a recommendation by HDFC Mutual Fund (“the Fund”) / HDFC Asset Management Company Limited (HDFC AMC) to buy or sell the stock or any other security. HDFC AMC is not indicating or guaranteeing returns on any investments. Past performance may or may not be sustained in the future and is not a guarantee of any future returns. The recipient(s), before taking any decision, should make their own investigation and seek appropriate professional advice.
MUTUAL FUND INVESTMENTS ARE SUBJECT TO MARKET RISKS, READ ALL SCHEME RELATED DOCUMENTS CAREFULLY.
Stay ahead with our insights
Did you find this interesting?
Your opinion matters - share your thoughts and help us improve.


