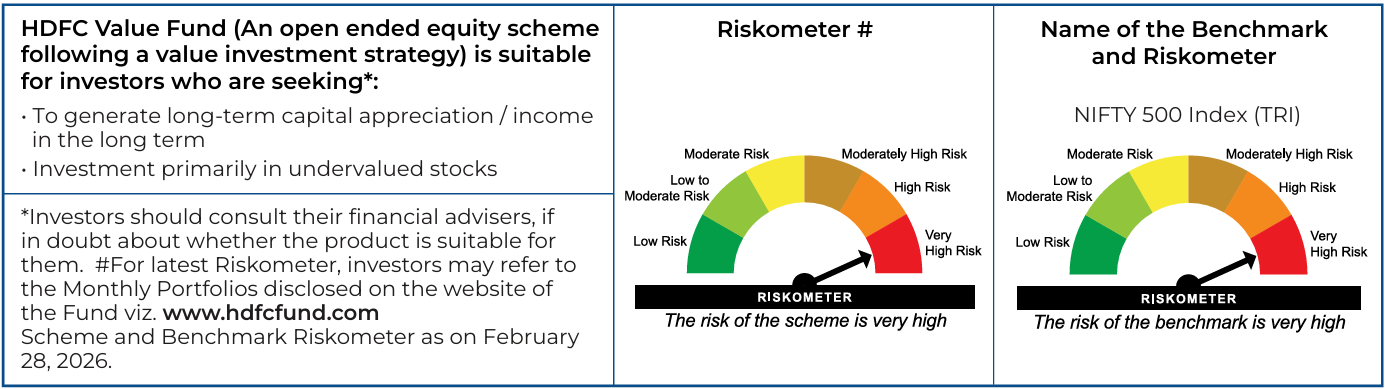
When Patience Meets Potential – HDFC Value Fund
Last Updated On: 9 Jun 2026


Value investing often requires patience. There can be periods when growth-oriented segments dominate market returns, causing value strategies to lag in the short term. However, over longer horizons, as business performance may improve and market perception changes, valuations may adjust accordingly.
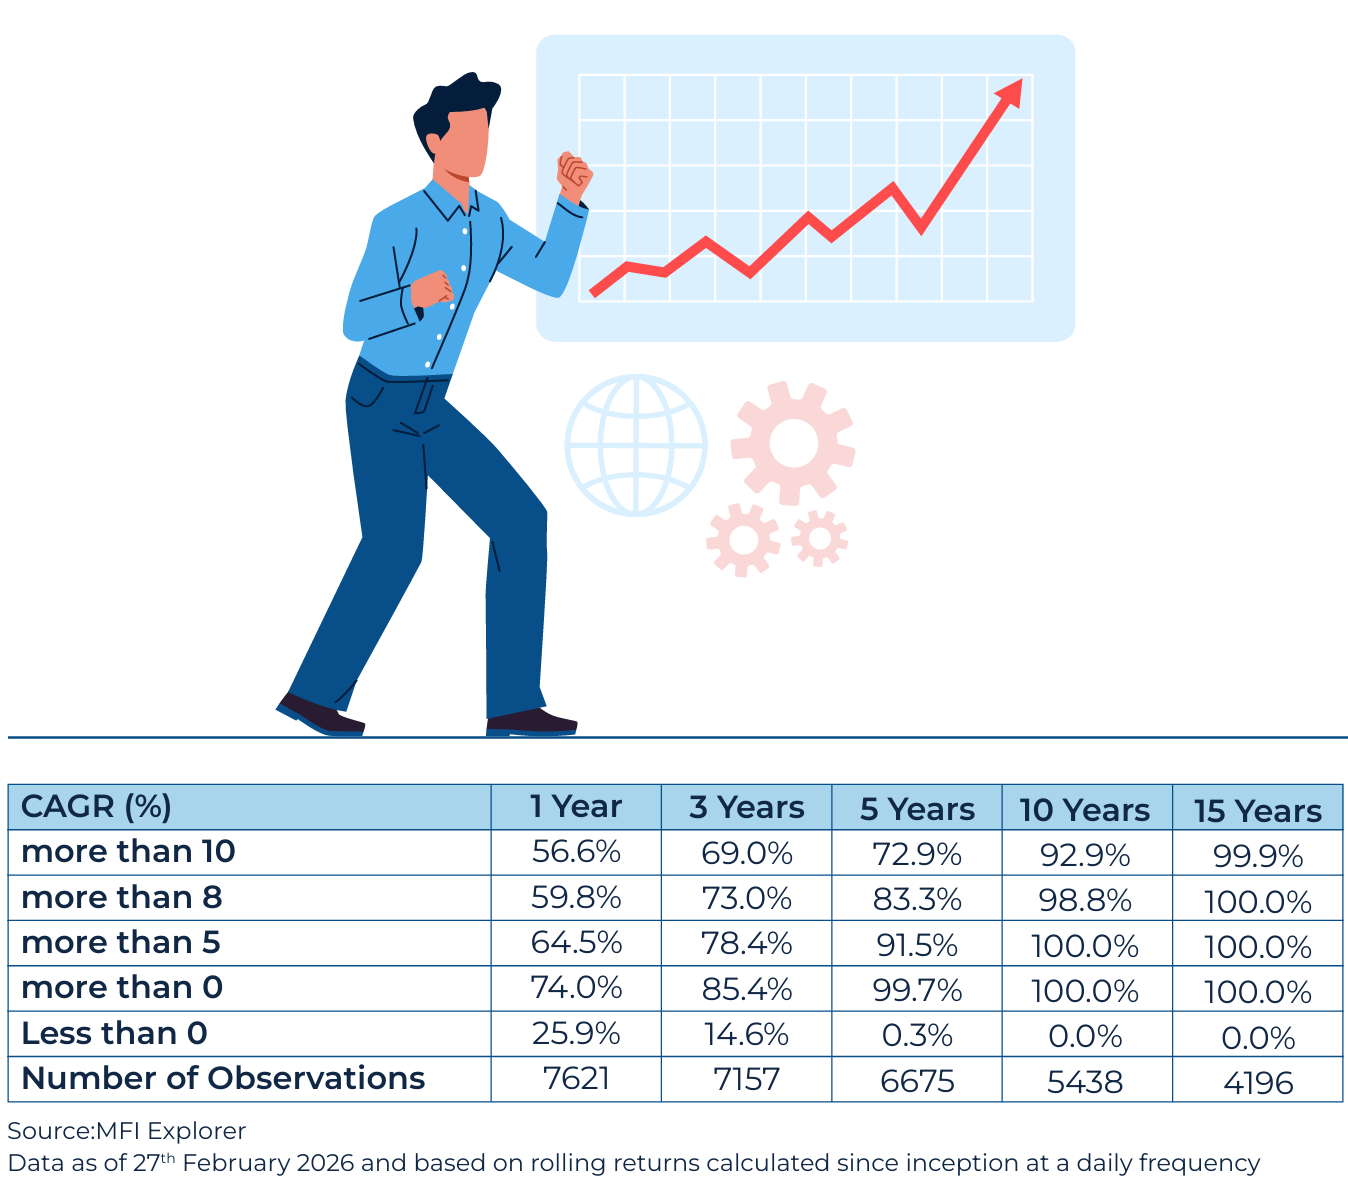
Since its inception in 1994, and having recently completed 32 years, the HDFC Value Fund has experienced a wide range of market environments.
Across market cycles, the fund has followed a disciplined investment approach and delivered better returns.
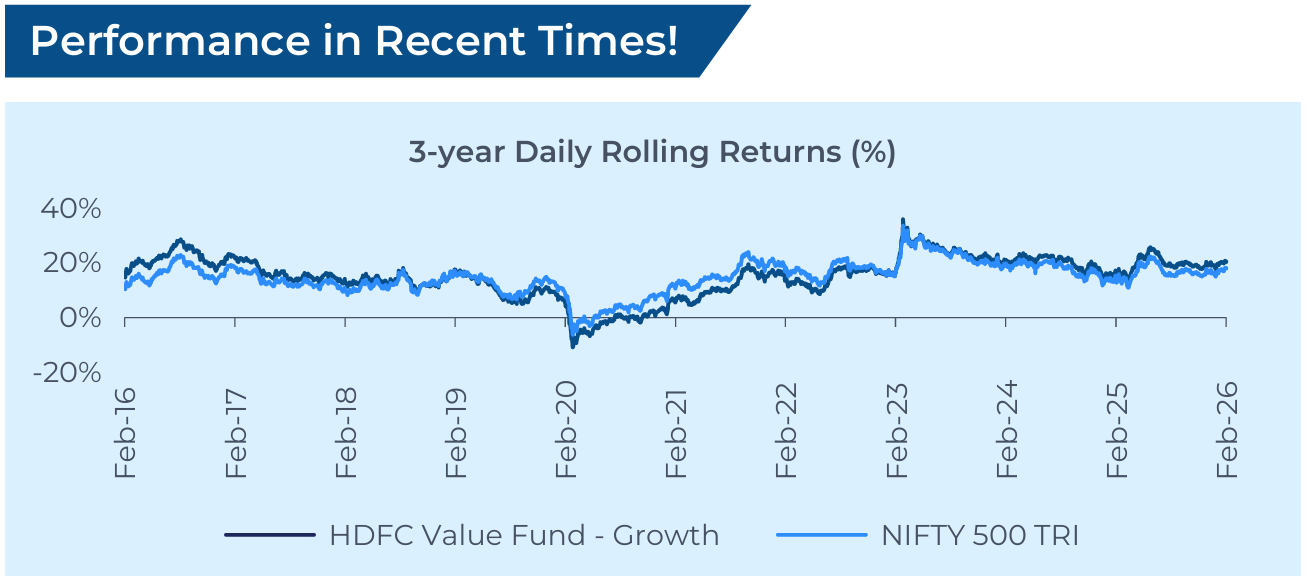
The 3-year daily rolling returns of the Fund has outperformed NIFTY 500 TRI ~99% of the times between 28-Feb-23 and 27-Feb-26.

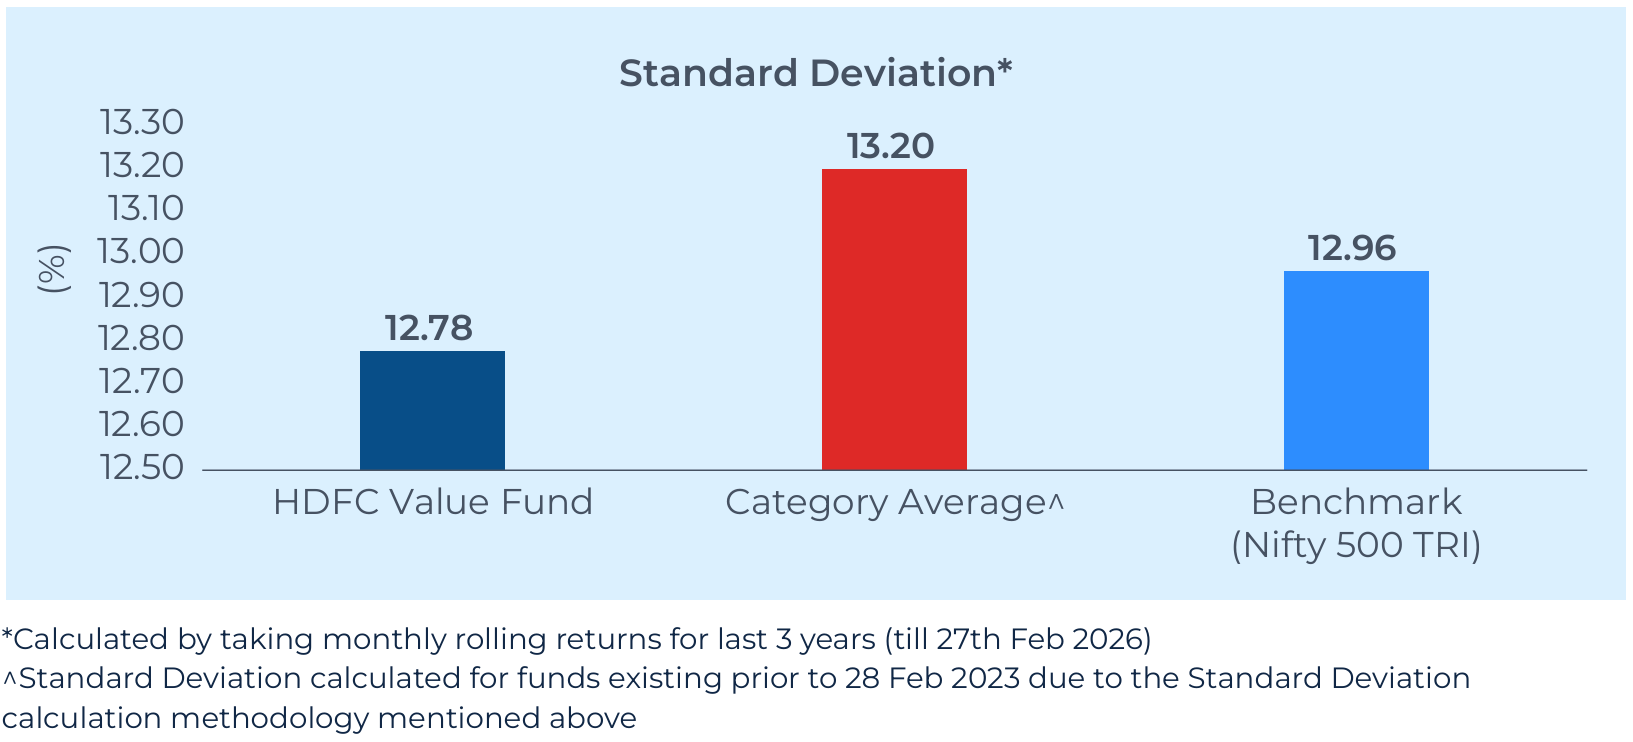
Apart from volatility, capture ratios also demonstrate a Fund’s risk-adjusted performance. Capture ratios exhibit how well the Fund participates in market gains and losses compared to the benchmark.
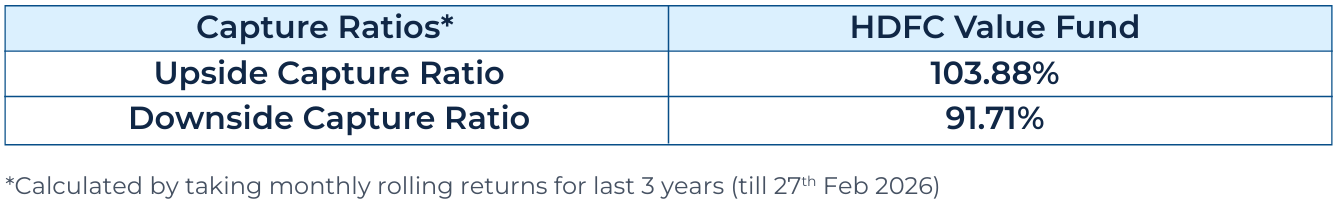
Overall, the Fund’s capture ratios indicate relatively better participation in positive market phases compared to the benchmark. Additionally, it shows that it has tended to decline relatively less than the benchmark during market downswings.

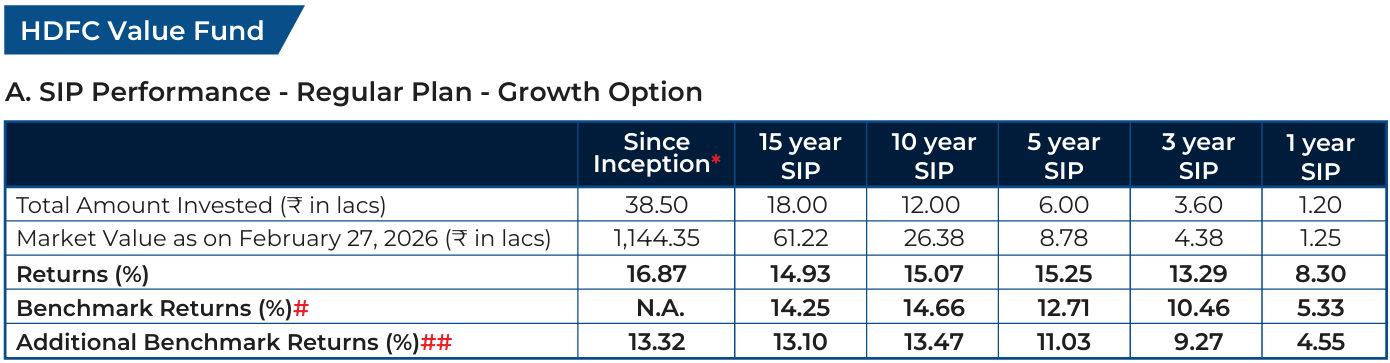
Assuming ₹10,000 invested systematically on the first Business Day of every month over a period of time. CAGR returns are computed after accounting for the cash flow by using XIRR method (investment internal rate of return) for Regular Plan - Growth Option. The above investment simulation is for illustrative purposes only and should not be construed as a promise on minimum returns and safeguard of capital. SIP - Systematic Investment Plan.
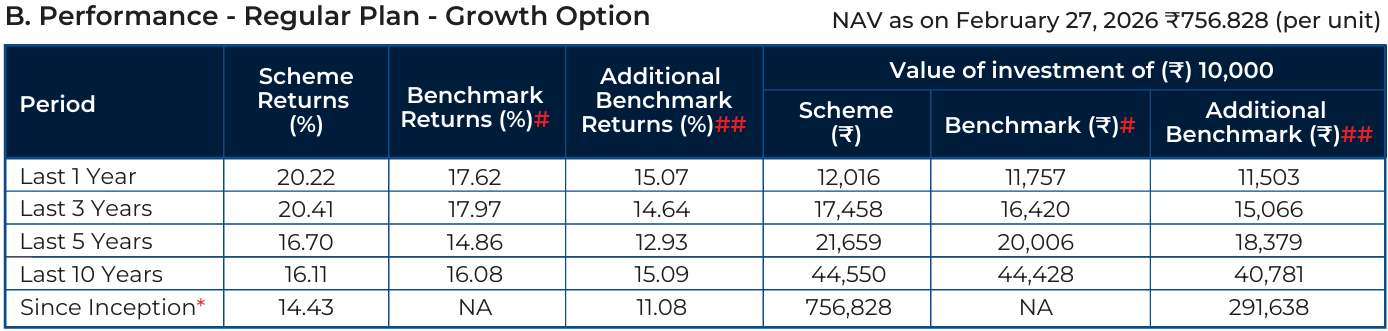
Common notes for above table A & B: Past performance may or may not be sustained in future and is not a guarantee of any future returns. *Inception Date: February 01, 1994. The scheme is managed by Mr. Anand Laddha since February 01, 2024. # NIFTY 500 Index (TRI). ## Nifty 50 Index (TRI). The expenses of the Direct Plan under the Scheme will be lower to the extent of the distribution expenses / commission charged in the Regular Plan. As NIFTY 50 TRI data is not available since inception of the scheme, additional benchmark performance is calculated using composite CAGR of NIFTY 50 PRI values from February 1, 1994 to June 29, 1999 and TRI values since June 30, 1999. Load is not taken into consideration for computation of performance. Returns greater than 1 year period are compounded annualized (CAGR). N.A.: Not Available. Returns as on February 27, 2026.
For performance of other funds managed by fund manager, Please click here.
Views expressed above are indicative and should not be construed as investment advice or as a substitute for financial planning. Due to the personal nature of investments, investors are advised to seek professional advice before investing.
MUTUAL FUND INVESTMENTS ARE SUBJECT TO MARKET RISKS, READ ALL SCHEME RELATED DOCUMENTS CAREFULLY.
Stay ahead with our insights
Did you find this interesting?
Your opinion matters - share your thoughts and help us improve.


