
- Entering text into the form field will trigger a list of options
Trending Searches
- Invest / Login
Aim to make the most of the market’s consolidation phase!

Last Updated On: 30 Sep 2026

Illustration:
Performance of the FTSE India Equity Index TRI over various horizon
The FTSE India Equity TRI (Total Return Index) has generated healthy returns over long-term horizons. The 10-year CAGR* was 13.3% as of August 31, 2026.
| Return Periods | CAGR* as on Aug 31, 2026 |
|---|---|
| FTSE India Equity TRI | |
| 1 year | 3.4% |
| 3 year | 13.0% |
| 5 year | 12.4% |
| 7 year | 15.7% |
| 10 year | 13.3% |

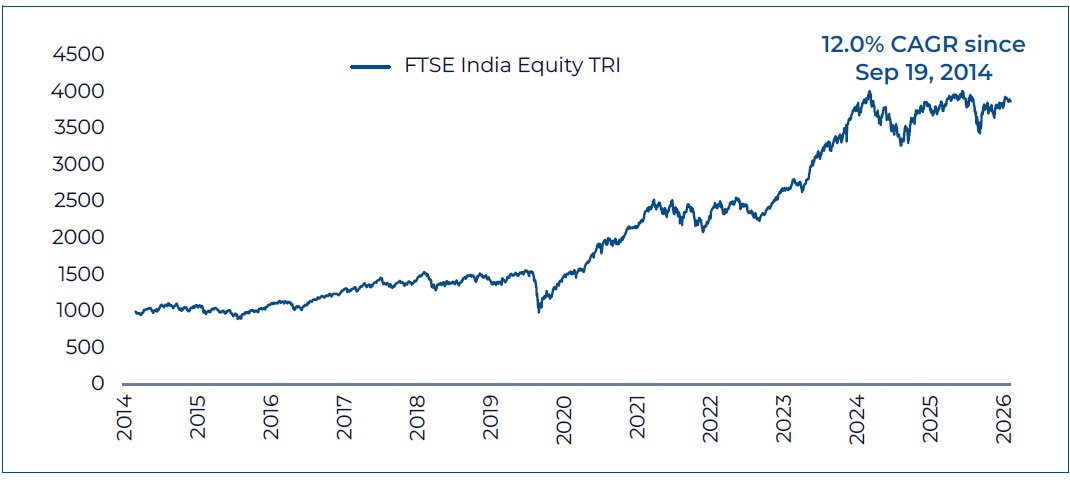
Source: FTSE Russell and internal calculations. As on Aug 31, 2026. Past performance may or may not be sustained in the future and is not a guarantee of any future returns. HDFC AMC/Mutual Fund is not guaranteeing or promising or forecasting any returns. *CAGR: Compounded Annual Growth Rate. Sep 19, 2014 is the inception date for the FTSE India Equity TRI.
The Premium of FTSE India Equity Index vs. FTSE Emerging Index is at a multi-year low, thus providing an entry point for investors looking to gain exposure to the FTSE India Equity Index.
Source: FTSE Russell, internal calculations. Premium is defined as [(FTSE India Equity Index PE / FTSE Emerging Index PE) – 1]. As of Aug 31, 2026. The FTSE Emerging Index provides investors with a comprehensive means of measuring the performance of the most liquid Large and Mid Cap companies in the emerging markets. TRI.
Characteristics of the FTSE India Equity Index TRI
The FTSE India Equity Index TRI:
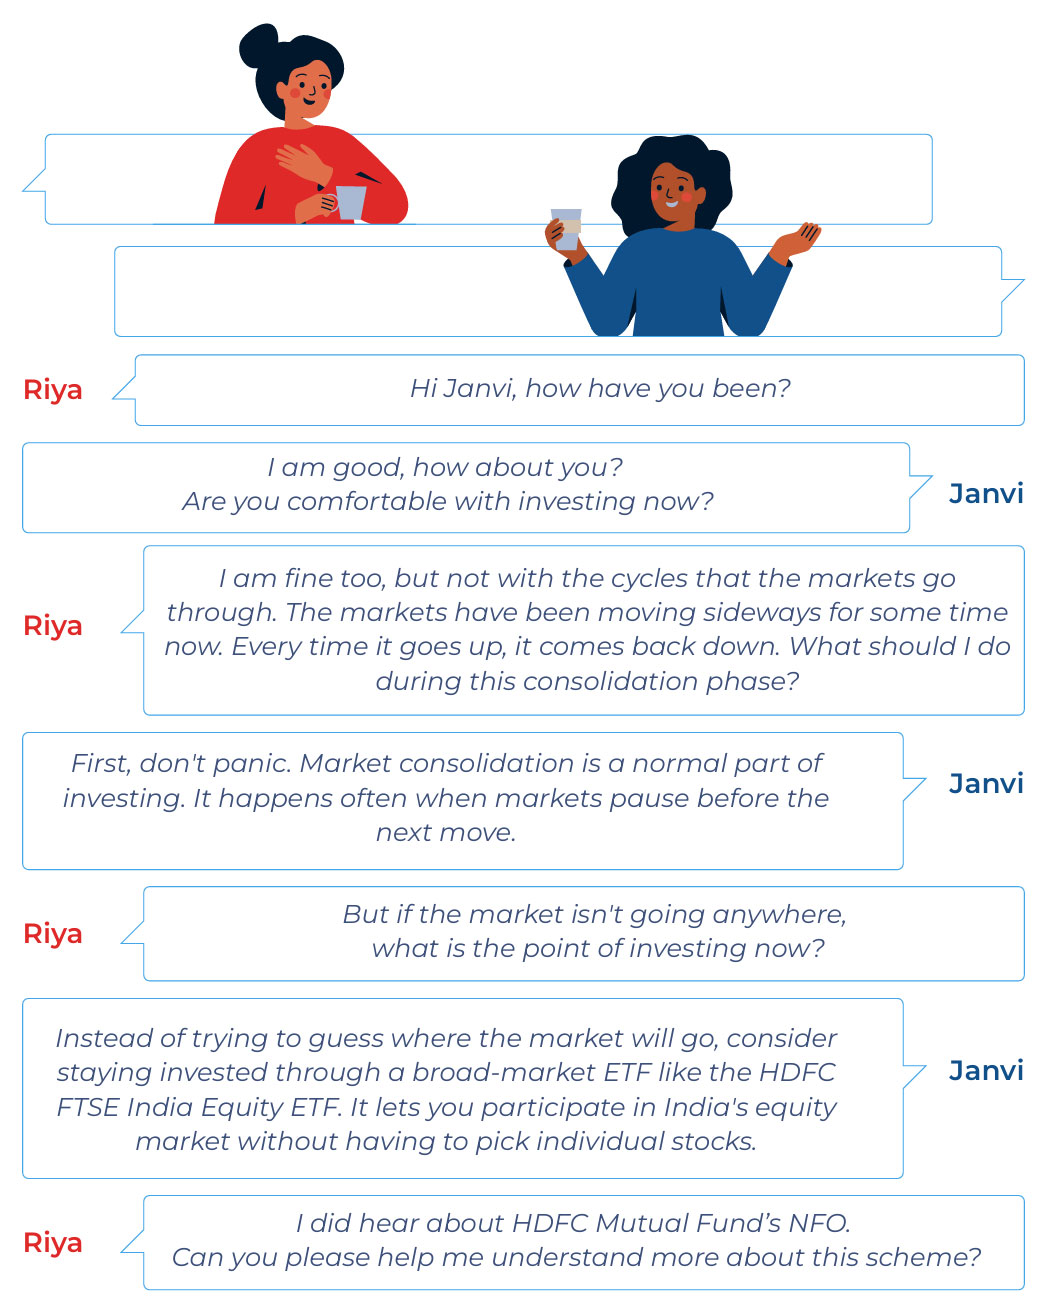
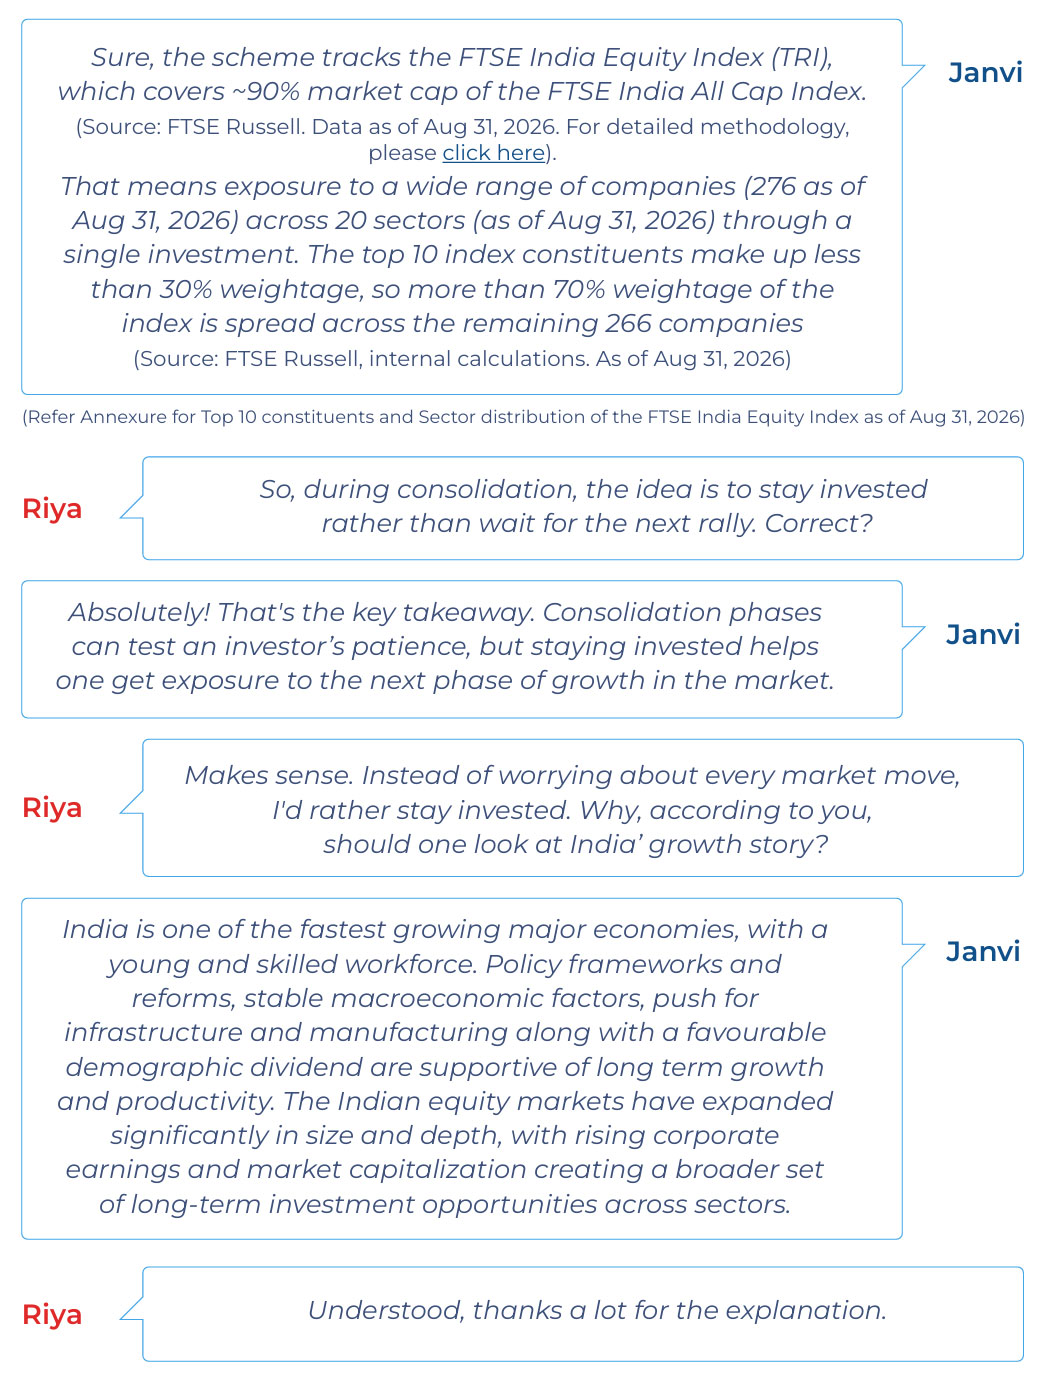
- Covers ~90% market cap of FTSE India All Cap Index
(Source: FTSE Russell. As of Aug 31, 2026.) - Provides diversification across multiple stocks and sectors
- FTSE India Equity TRI has generated healthy returns over long-term horizons
Risks and Mitigations
As the Scheme aims to track the FTSE India Equity Index (TRI) before expenses, it is inherently exposed to broad market movements which will directly impact the Scheme’s performance. Being a passive strategy, the Scheme will mirror the stock concentration and volatility profile of the underlying index, subject only to tracking error. No additional risk will arise from active fund manager decisions, as the Scheme does not undertake discretionary stock or sector allocations.
The Fund Manager will endeavour to minimise tracking error through disciplined rebalancing, efficient execution, and maintaining cash levels at the lowest practical threshold. While these measures are expected to substantially mitigate the above risks to a large extent, there can be no assurance that these risks would be completely eliminated
Conclusion
India is growing faster than many other economies and its economic fundamentals are steady. The HDFC FTSE India Equity ETF offers one way to invest in India’s broad equity market with a single investment that covers 276 companies and 20 sectors
(Source: FTSE Russell, AMFI Industry Classification, internal calculations. As of Aug 31, 2026).

Investors can participate in India’s broad-based growth story via the HDFC FTSE India Equity ETF (NFO between 23rd September to 7th October, 2026)
HDFC Bank (Sponsor of HDFC Mutual Fund) is not liable or responsible for any loss or shortfall resulting from the operations of the scheme.
Top 10 constituents of the FTSE India Equity Index TRI
| Company Name | Weightage (%) |
|---|---|
| Reliance Industries Ltd. | 5.33% |
| HDFC Bank Ltd.£ | 5.02% |
| ICICI Bank Ltd. | 4.79% |
| Bharti Airtel Ltd. | 3.42% |
| Infosys Ltd. | 2.39% |
| Mahindra & Mahindra Ltd. | 1.89% |
| Axis Bank Ltd. | 1.86% |
| Bajaj Finance Ltd. | 1.79% |
| Larsen & Toubro Ltd. | 1.70% |
| Tata Consultancy Services Ltd. | 1.52% |
| Total of Top 10 Constituents | 29.72% |
£ Sponsor of HDFC Mutual Fund
Source: FTSE Russell, AMFI Industry Classification, internal calculations. As of Aug 31, 2026.
Sector distribution of the FTSE India Equity Index TR
| Sector Name | Weightage (%) |
|---|---|
| Financial Services | 28.2% |
| Oil, Gas & Consumable Fuels | 8.3% |
| Automobile and Auto Components | 8.0% |
| Information Technology | 7.5% |
| Healthcare | 7.4% |
| Capital Goods | 7.2% |
| Metals & Mining | 4.8% |
| Fast Moving Consumer Goods | 4.7% |
| Telecommunication | 4.2% |
| Power | 3.9% |
| Consumer Services | 3.8% |
| Consumer Durables | 3.2% |
| Construction Materials | 2.2% |
| Construction | 1.8% |
| Services | 1.7% |
| Chemicals | 1.7% |
| Realty | 1.2% |
| Textiles | 0.1% |
| Diversified | 0.1% |
| Media. Entertainment & Publication | 0.0% |
Source: FTSE Russell, AMFI Industry Classification, internal calculations. As of Aug 31, 2026

*Investors should consult their financial advisers, if in doubt about whether the product is suitable for them
#The product labeling assigned during the NFO is based on internal assessment of the scheme characteristics or model portfolio and the same may vary post NFO when the actual investments are made.
#For latest riskometer, investors may refer to the Monthly Portfolios disclosed on the website of the Fund viz. www.hdfcfund.com
Views expressed above are indicative and should not be construed as investment advice or as a substitute for financial planning. Due to the personal nature of investments, investors are advised to seek professional advice before investing.
MUTUAL FUND INVESTMENTS ARE SUBJECT TO MARKET RISKS, READ ALL SCHEME RELATED DOCUMENTS CAREFULLY.
Stay ahead with our insights
Did you find this interesting?
Your opinion matters - share your thoughts and help us improve.