- Entering text into the form field will trigger a list of options
Trending Searches
- Invest / Login

लाटांना तुमची दीर्घकालीन नौका डोलवू देऊ नका!

Last Updated On: 9 Nov 2026

बाजार दररोज वर-खाली होऊ शकतात. उद्दिष्ट गाठणारे गुंतवणूकदार बहुतेक वेळा चढ-उताराच्या काळातही आपल्या मार्गावर ठाम राहणारे असतात.
गेल्या काही महिन्यांत भारतीय इक्विटी बाजारांत घसरणीचा टप्पा दिसला; वर्षभरापूर्वी चांगले दिसणारे पोर्टफोलिओ आता तोटा दाखवू शकतात. अस्वस्थ वाटणे साहजिक आहे. पण अल्पकालीन घसरण हा इक्विटी गुंतवणुकीचा सामान्य भाग आहे, आणि कोणत्याही एका वाईट महिन्यापेक्षा किंवा वर्षापेक्षा बाजारात टिकून राहिलेला काळ जास्त महत्त्वाचा.
या अंकात चढ-उतार म्हणजे काय, अल्पकालीन तोट्यांबद्दल आकडेवारी काय सांगते आणि दीर्घकालीन दृष्टिकोन गुंतवणूकदारांना लाटांमध्येही स्थिर राहण्यास कशी मदत करू शकतो, ते पाहू.

समुद्र कधीच पूर्ण शांत नसतो, समभाग बाजारही तसाच. पोर्टफोलिओ किती चढ-उताराचा दिसतो, हे आपण तो किती जवळून पाहतो यावर खूप अवलंबून असते. तीच गुंतवणूक एका महिन्यात चिंताजनक, तर एका दशकात फायदेशीर दिसू शकते.
गुंतवणुकीचे मूल्यमापन कोणत्या कालावधीत केले जाते, याचा तिच्या कामगिरीच्या दिसण्यावर लक्षणीय परिणाम होऊ शकतो.
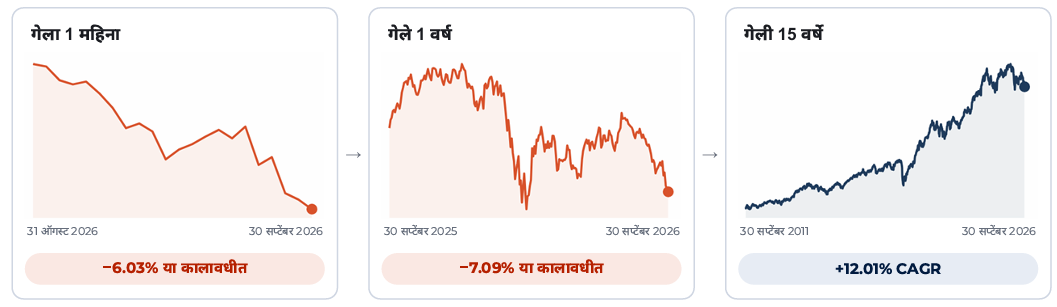
एक महिना आणि एक वर्षाचे दृष्टिकोन तुलनेने कमी कालावधी घेऊन घसरण दाखवतात. 15 वर्षांचा दृष्टिकोन अनेक बाजार चक्रे सामावून घेऊन बरेच वेगळे चित्र दाखवतो.
मागील कामगिरी भविष्यात टिकू शकते किंवा टिकणारही नाही आणि ती कोणत्याही भावी परताव्याची हमी नाही. HDFC AMC / HDFC MF गुंतवणुकीवर कोणत्याही परताव्याची हमी किंवा वचन देत नाही.
वास्तविक परतावा 30 सप्टेंबर 2026 पर्यंतच्या Nifty 50 TRI मूल्यांवर आधारित आहे; 1 वर्षाहून कमी कालावधीसाठी निरपेक्ष परतावा, 1 वर्ष किंवा अधिकसाठी चक्रवाढ वार्षिक परतावा. स्रोत: MFI 360
गुंतवणुकीचा कालावधी वाढला की एका वर्षाचा प्रभाव एकूण अनुभवावर कमी होऊ शकतो. 30 सप्टेंबर 2007 ते 30 सप्टेंबर 2026 या काळातील Nifty 50 TRI च्या प्रत्येक रोलिंग कालावधीकडे पाहिल्यास, होल्डिंग कालावधी वाढताच सर्वोत्तम आणि सर्वात वाईट निकालातील अंतर झपाट्याने कमी होते.
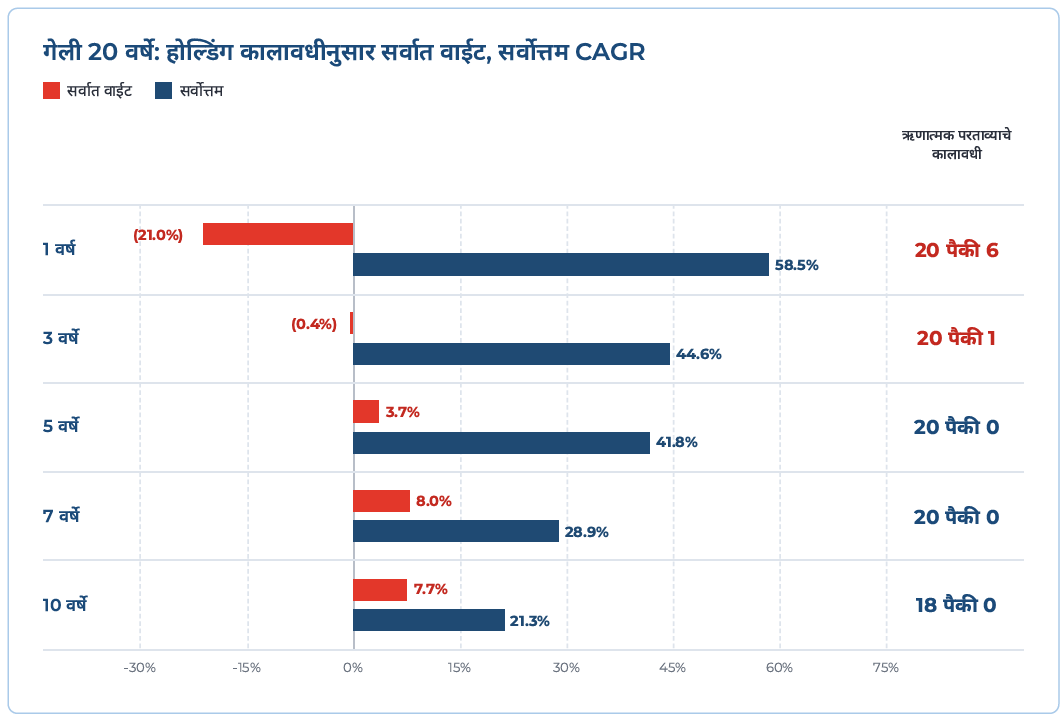
प्रत्येक पट्टी 30 सप्टेंबर 2007 ते 30 सप्टेंबर 2026 मधील सर्व रोलिंग कालावधींतील सर्वाधिक आणि सर्वात कमी CAGR परतावा दाखवते. उदाहरणार्थ, 10 वर्षांच्या होल्डिंग कालावधीत ऋणात्मक परताव्याची उदाहरणे शून्य आहेत.
CAGR - चक्रवाढ वार्षिक वाढीचा दर
मागील कामगिरी भविष्यात टिकू शकते किंवा टिकणारही नाही आणि ती कोणत्याही भावी परताव्याची हमी नाही. HDFC AMC / HDFC MF गुंतवणुकीवर कोणत्याही परताव्याची हमी किंवा वचन देत नाही.
वास्तविक परतावा 30 सप्टेंबर 2026 पर्यंतच्या Nifty 50 TRI मूल्यांवर आधारित आहे. स्रोत: MFI 360.
पद्धतशीर गुंतवणूक योजना (SIP) बाजाराची दिशा काहीही असो शिस्तबद्ध गुंतवणूक लागू करत असल्याने, चढ-उताराच्या बाजारांत परिणामकारक मानल्या जातात.
वेगवेगळ्या बाजार परिस्थितींत SIP युनिट्स खरेदी करत राहते, म्हणजे घसरणीत कमी किमतीत जास्त युनिट्स मिळतात. दीर्घकालीन दृष्टीने हे चांगल्या परताव्याला कारणीभूत ठरू शकते.
HDFC Flexi Cap Fund मध्ये दरमहा ₹ 10,000 च्या SIP चा विचार करा.
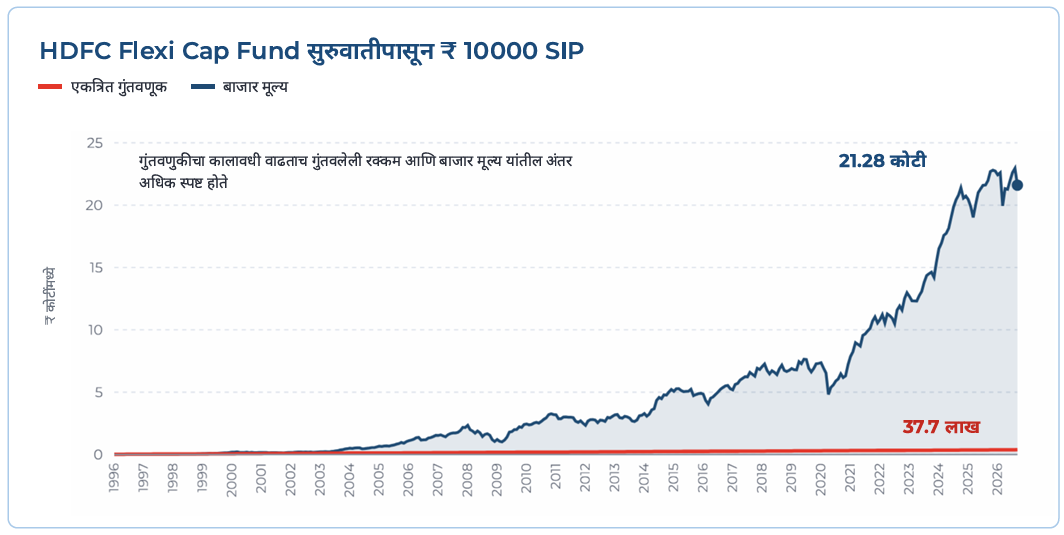
योजना सुरू झाल्याची तारीख: 1 जानेवारी 1995. वरील NAV Regular Plan - Growth Option चे आहेत. मागील कामगिरी भविष्यात टिकू शकते किंवा टिकणारही नाही आणि ती कोणत्याही भावी परताव्याची हमी नाही. आकडेवारी 30 सप्टेंबर 2026 पर्यंत. HDFC AMC / HDFC MF या योजनेतील गुंतवणुकीवर कोणत्याही परताव्याची हमी किंवा वचन देत नाही.
हायब्रिड फंड चढ-उतार लपवण्यास आणि मालमत्ता वाटपास मदत करू शकतात:
हायब्रिड फंड इक्विटी आणि डेट अशा दोन्हींत गुंतवणूक करतात; यामुळे चढ-उताराच्या बाजारांत पोर्टफोलिओचे हेलकावे कमी होण्यास मदत होऊ शकते आणि कालांतराने इक्विटीतील सहभाग टिकून राहतो. उदाहरणार्थ, HDFC Balanced Advantage Fund सारखे फंड बाजार परिस्थितीनुसार इक्विटी आणि डेट एक्स्पोजर गतिशीलपणे सांभाळतात; त्यामुळे गुंतवणूकदारांना वारंवार हाताने बदल न करता मालमत्ता वाटपाशी सुसंगत राहता येते.
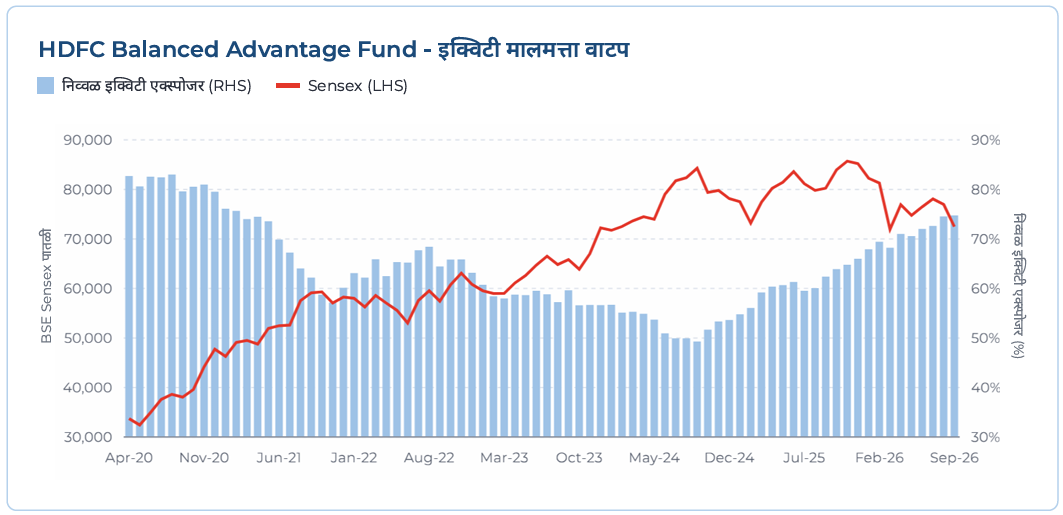
योजनेच्या मालमत्ता वाटपाच्या अधिक तपशिलासाठी संबंधित योजना माहिती दस्तऐवज पाहा. सूचना: *योजना सर्व वेळी इक्विटी वाटप (हेज्ड + अनहेज्ड) किमान 65% ठेवते. वरील आकृती ढोबळ सूचक आहे आणि बाजार परिस्थितीनुसार फंड व्यवस्थापक ती बदलू शकतात. आकडेवारी 30 सप्टेंबर 2026 पर्यंत
चढ-उतारांमध्ये गुंतवणुकीचा आणखी एक महत्त्वाचा पैलू म्हणजे योग्य मानसिकता. चढ-उतार हाताळण्यासाठी काही सूचना –
बाजाराची वेळ साधणे सोपे नाही आणि बाजारातील शक्तींवर आपले नियंत्रणही नसते. म्हणून आपल्या गुंतवणूक योजनेशी बांधील राहणे, आपली मानसिकता सांभाळणे आणि चढ-उताराच्या बाजारांतही आपली गुंतवणूक दीर्घकाळ टिकवण्यास तयार असणे महत्त्वाचे. चढ-उताराला आपला सोबती बनवा!
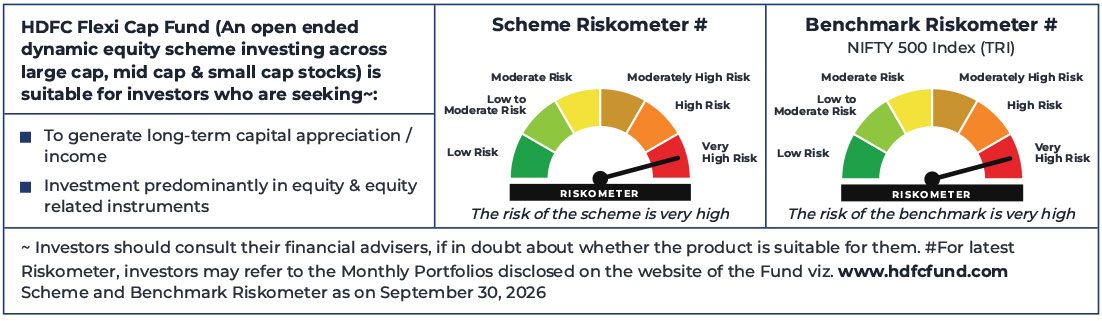
An open ended dynamic equity scheme investing across large cap, mid cap & small cap stocks.
A. SIP Performance^ - Regular Plan - Growth Option
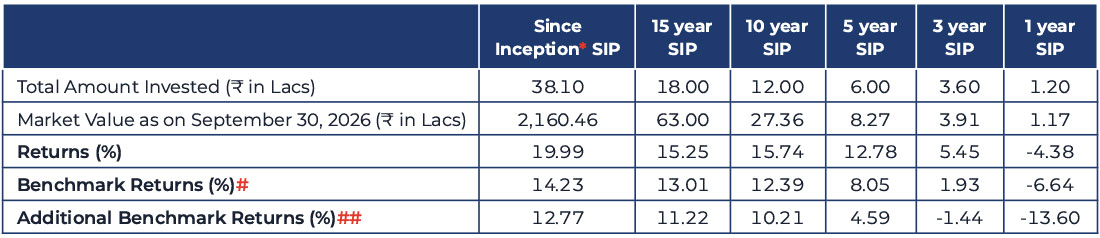
Assuming ₹ 10,000 invested systematically on the first Business Day of every month over a period of time. CAGR returns are computed after accounting for the cash flow by using XIRR method (investment internal rate of return) for Regular Plan - Growth Option. The above investment simulation is for illustrative purposes only and should not be construed as a promise on minimum returns and safeguard of capital. SIP - Systematic Investment Plan.
B. Performance^- Regular Plan - Growth Option
NAV as on September 30, 2026. ₹1,968.685 (per unit)
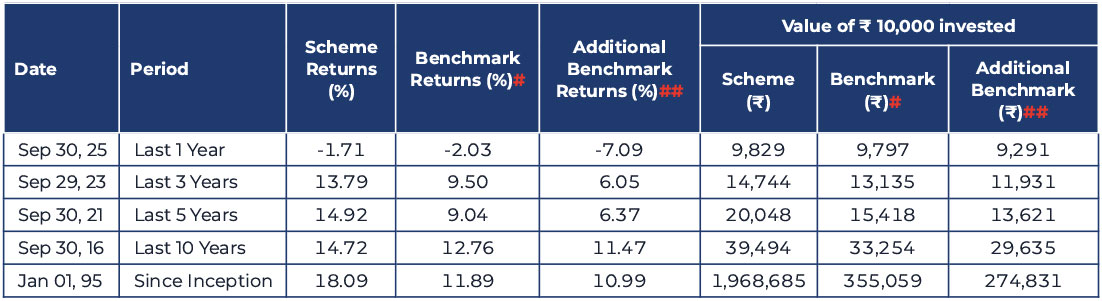
Common notes for the above table A & B: ^Past Performance may or may not be sustained in future and is not a guarantee of any future returns. HDFC AMC / HDFC MF is not guaranteeing or assuring any returns on investments in this Scheme. *Inception Date: January 1, 1995. The scheme is co-managed by Mr. Amit Ganatra (since February 01, 2026) and Mr. Bhagyesh Kagalkar (since August 26, 2026). # NIFTY 500 Index (TRI). ## Nifty 50 Index (TRI). The above returns are of Regular Plan – Growth Option. Returns greater than 1 year period are compounded annualized (CAGR). Load is not taken into consideration for computation of performance. Different Plans viz. Regular Plan and Direct Plan have a different expense structure. The expenses of the Direct Plan under the Scheme will be lower to the extent of the distribution expenses / commission charged in the Regular Plan. As NIFTY 50 TRI data is not available since inception of the scheme, additional benchmark performance is calculated using composite CAGR of NIFTY 50 PRI values from January 1, 1995 to June 29, 1999 and TRI values since June 30, 1999. Above returns are as on September 30, 2026.
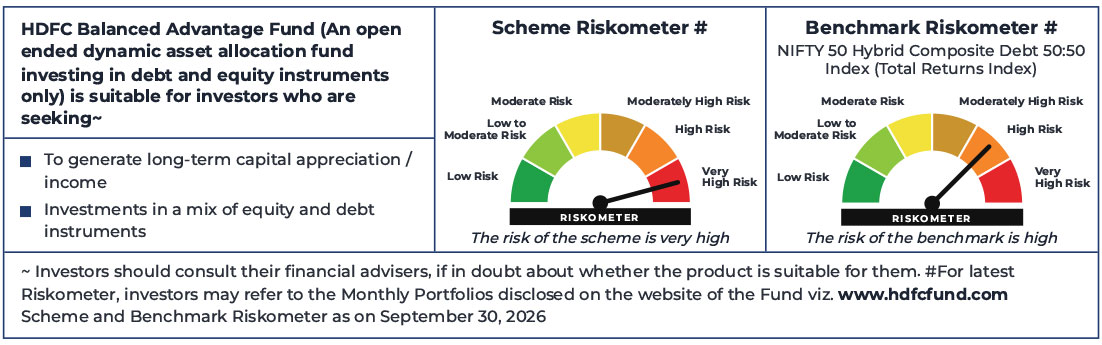
An open ended dynamic asset allocation fund investing in debt and equity instruments only.
A. SIP Performance^- Regular Plan - Growth Option
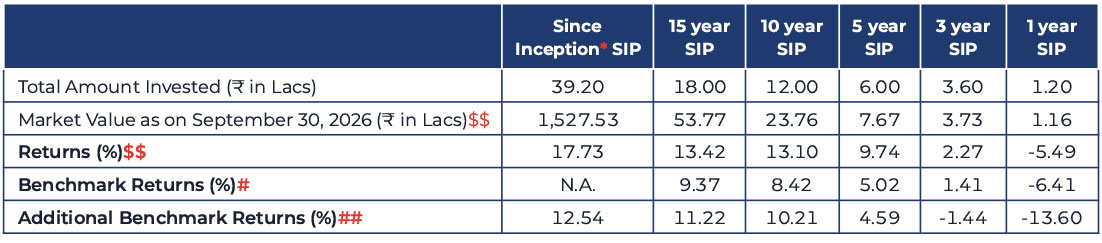
Assuming ₹ 10,000 invested systematically on the first Business Day of every month over a period of time. CAGR returns are computed afteraccounting for the cash flow by using XIRR method (investment internal rate of return) for Regular Plan - Growth Option. The above investmentsimulation is for illustrative purposes only and should not be construed as a promise on minimum returns and safeguard of capital. SIP -Systematic Investment Plan.
B. Performance^- Regular Plan - Growth Option
NAV as on September 30, 2026. ₹505.327 (per unit)
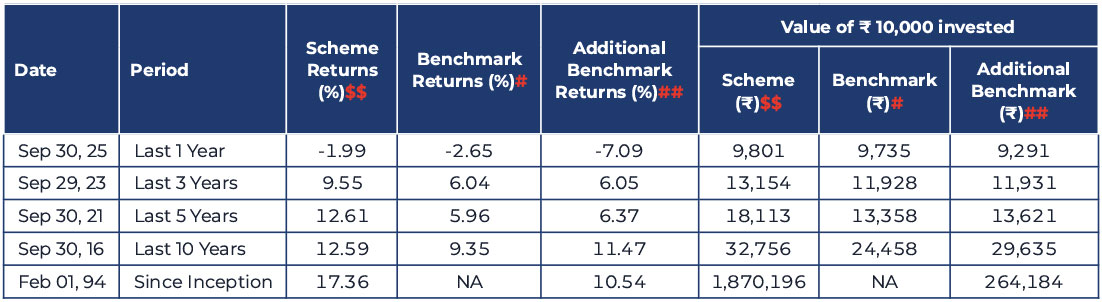
Common notes for the above table A & B: ^Past performance may or may not be sustained in future and is not a guarantee of any future returns. HDFC AMC / HDFC MF is not guaranteeing or assuring any returns on investments in this Scheme. *Inception Date: February 01, 1994. The scheme is co-managed by Mr. Gopal Agrawal (Equity Portfolio) (since July 29, 2022), Mr Ihab Dalwai (Equity Portfolio) (since September 11, 2026),Mr. Arun Agarwal (Arbitrage Assets) (since October 6, 2022), Nandita Menezes (Arbitrage Assets) (since March 29, 2025) and Mr. Anil Bamboli (Debt Portfolio) (since July 29, 2022). # NIFTY 50 Hybrid Composite Debt 50:50 Index (Total Returns Index). ## Nifty 50 Index (TRI). $$ All Distributions declared prior to the splitting of the Scheme into IDCW & Growth Options are assumed to be reinvested in the units of the Scheme at the then prevailing NAV (ex-distribution NAV). As NIFTY 50 TRI data is not available since inception of the scheme, additional benchmark performance is calculated using composite CAGR of NIFTY 50 PRI values from February 1, 1994 to June 29, 1999 and TRI values since June 30, 1999. Scheme performance may not strictly be comparable with that of its Additional Benchmark in view of balanced nature of the scheme where a portion of scheme’s investments are made in debt instruments. Returns greater than 1 year period are compounded annualized (CAGR). Load is not taken into consideration for computation of performance. Different plans viz. Regular Plan and Direct Plan have a different expense structure. The expenses of the Direct Plan under the Scheme will be lower to the extent of the distribution expenses / commission charged in the Regular Plan. Returns as on 30 September, 2026
For performance of other funds managed by fund manager, Please Click here
Note: @@Effective close of business hours of June 1, 2018, HDFC Prudence Fund merged with HDFC Growth Fund (HDFC Balanced Advantage Fund after changes in fundamental attributes). As the portfolio characteristics and the broad investment strategy of HDFC Balanced Advantage Fund is similar to that of erstwhile HDFC Prudence Fund, the track record (i.e. since inception date, dividend history, etc.) and past performance of erstwhile HDFC Prudence Fund has been considered, in line with SEBI circular on Performance disclosure post consolidation/ merger of scheme dated April 12, 2018.
Views expressed above are indicative and should not be construed as investment advice or as a substitute for financial planning. Due to the personal nature of investments, investors are advised to seek professional advice before investing.
MUTUAL FUND INVESTMENTS ARE SUBJECT TO MARKET RISKS, READ ALL SCHEME RELATED DOCUMENTS CAREFULLY.
Stay ahead with our insights
Did you find this interesting?
Your opinion matters - share your thoughts and help us improve.