- Entering text into the form field will trigger a list of options
Trending Searches
- Invest / Login

लहरों को आपकी लंबी अवधि की नाव डगमगाने न दें!

Last Updated On: 9 Nov 2026

बाजार हर दिन चढ़-उतर सकते हैं। अपने लक्ष्य तक वही निवेशक पहुँचते हैं जो उतार-चढ़ाव भरे दौर में भी अपनी राह पर टिके रहते हैं।
बीते कई महीनों में भारतीय इक्विटी बाजारों में गिरावट आई है, और साल भर पहले जो पोर्टफोलियो अच्छे दिखते थे, उनमें अब नुकसान दिख सकता है। बेचैनी महसूस होना स्वाभाविक है। लेकिन अल्पकालिक गिरावट इक्विटी निवेश का सामान्य हिस्सा है, और किसी एक बुरे महीने या साल से कहीं ज्यादा मायने बाजार में बिताए समय के हैं।
इस अंक में हम देखेंगे कि अस्थिरता क्या है, अल्पकालिक नुकसान के बारे में आँकड़े क्या कहते हैं, और लंबी अवधि का नजरिया निवेशकों को लहरों के बीच टिके रहने में कैसे मदद कर सकता है।

समुद्र कभी पूरी तरह शांत नहीं रहता, और शेयर बाजार भी नहीं। पोर्टफोलियो कितना अस्थिर दिखता है, यह बहुत हद तक इस पर निर्भर है कि हम उसे कितने करीब से देखते हैं। एक ही निवेश एक महीने में चिंताजनक और एक दशक में फायदेमंद दिख सकता है।
निवेश का मूल्यांकन जिस अवधि में किया जाता है, वह उसके प्रदर्शन की तस्वीर को काफी हद तक प्रभावित कर सकती है।
एक महीने और एक साल के नजरिए अपेक्षाकृत छोटी अवधि को दर्शाते हैं और गिरावट दिखाते हैं। 15 साल का नजरिया कई बाजार चक्रों को समेटता है और काफी अलग तस्वीर पेश करता है।
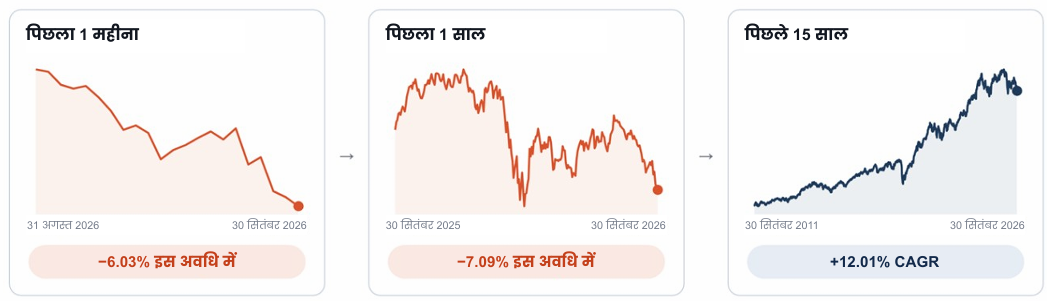
पिछला प्रदर्शन भविष्य में बना रह भी सकता है और नहीं भी, तथा यह किसी भी भावी रिटर्न की गारंटी नहीं है। HDFC AMC / HDFC MF किसी भी निवेश पर कोई रिटर्न की गारंटी या आश्वासन नहीं दे रहा है।
वास्तविक रिटर्न 30 सितंबर 2026 तक के Nifty 50 TRI मानों पर आधारित हैं; 1 साल से कम अवधि के लिए निरपेक्ष रिटर्न, 1 साल या उससे अधिक अवधि के लिए चक्रवृद्धि वार्षिक रिटर्न। स्रोत: MFI 360
निवेश की अवधि जितनी लंबी होगी, किसी एक साल का समग्र अनुभव पर प्रभाव उतना कम हो सकता है। 30 सितंबर 2007 से 30 सितंबर 2026 तक Nifty 50 TRI की हर रोलिंग अवधि देखें तो होल्डिंग अवधि बढ़ने के साथ सबसे अच्छे और सबसे खराब नतीजे का अंतर तेजी से घटता है।
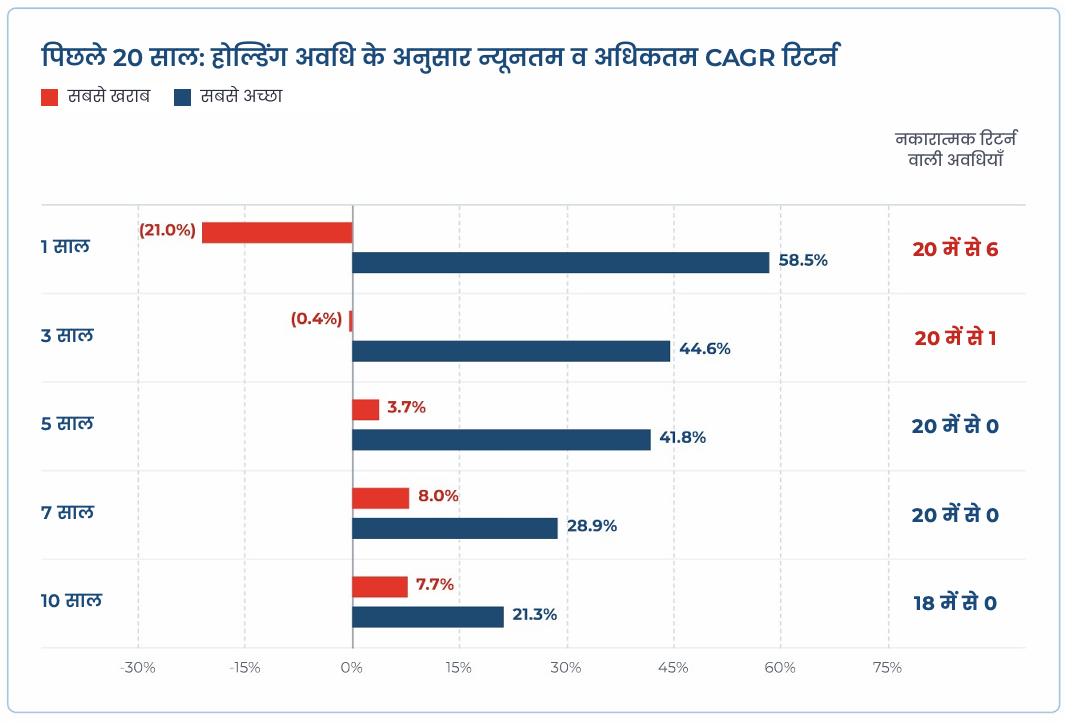
प्रत्येक बार 30 सितंबर 2007 से 30 सितंबर 2026 तक की सभी रोलिंग अवधियों में सबसे ऊँचा और सबसे निचला CAGR रिटर्न दिखाता है। उदाहरण के लिए, 10 साल की होल्डिंग अवधि में नकारात्मक रिटर्न के मामले शून्य हैं।
CAGR - चक्रवृद्धि वार्षिक वृद्धि दर
पिछला प्रदर्शन भविष्य में बना रह भी सकता है और नहीं भी, तथा यह किसी भी भावी रिटर्न की गारंटी नहीं है। HDFC AMC / HDFC MF किसी भी निवेश पर कोई रिटर्न की गारंटी या आश्वासन नहीं दे रहा है।
वास्तविक रिटर्न 30 सितंबर 2026 तक के Nifty 50 TRI मानों पर आधारित हैं। स्रोत: MFI 360।
व्यवस्थित निवेश योजना (SIP) अस्थिर बाजारों में असरदार मानी जाती है, क्योंकि यह बाजार की दिशा से परे अनुशासित निवेश करवाती है।
SIP अलग-अलग बाजार हालात में यूनिट खरीदती रहती है, यानी गिरावट में कम कीमत पर ज्यादा यूनिट मिलती हैं। लंबी अवधि के नजरिए से देखने पर इससे रिटर्न बेहतर हो सकता है।
HDFC Flexi Cap Fund में ₹ 10,000 की मासिक SIP पर विचार करें।
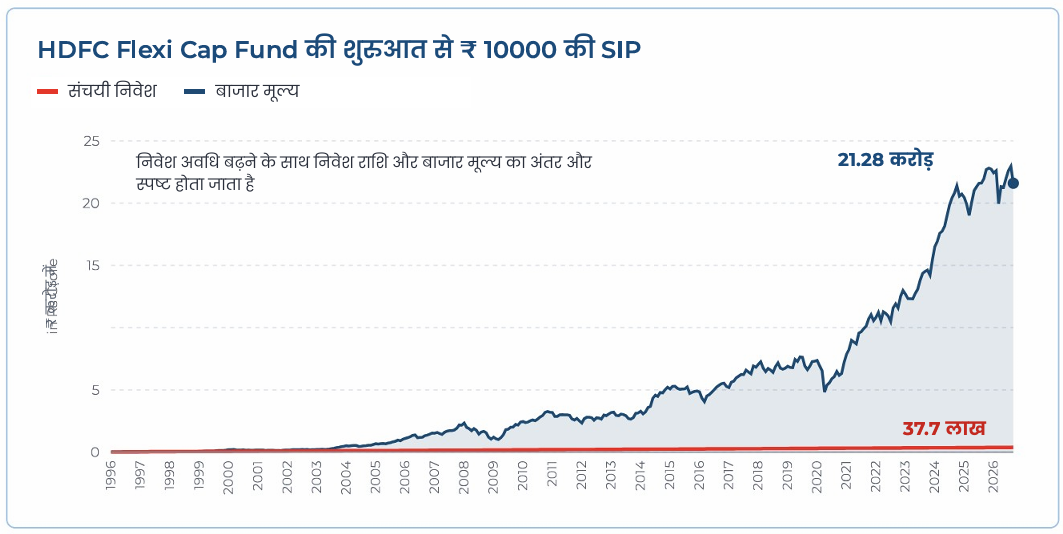
स्कीम की शुरुआत की तिथि: 1 जनवरी 1995। उपरोक्त NAV, Regular Plan - Growth Option के हैं। पिछला प्रदर्शन भविष्य में बना रह भी सकता है और नहीं भी, तथा यह किसी भी भावी रिटर्न की गारंटी नहीं है। आँकड़े 30 सितंबर 2026 तक के हैं। HDFC AMC / HDFC MF इस स्कीम में निवेश पर किसी रिटर्न की गारंटी या आश्वासन नहीं दे रहा है।
हाइब्रिड फंड अस्थिरता को छिपाने और परिसंपत्ति आवंटन में सहायक हो सकते हैं:
हाइब्रिड फंड इक्विटी और डेट दोनों में निवेश करते हैं, जो अस्थिर बाजारों में पोर्टफोलियो के उतार-चढ़ाव को कम करने में मदद कर सकता है और साथ ही समय के साथ इक्विटी में भागीदारी बनाए रखता है। उदाहरण के लिए, HDFC Balanced Advantage Fund जैसे फंड बाजार की स्थितियों के अनुसार इक्विटी और डेट एक्सपोजर को गतिशील रूप से संभालते हैं, जिससे निवेशकों को बार-बार हाथ से बदलाव किए बिना परिसंपत्ति आवंटन के अनुरूप बने रहने में मदद मिलती है।
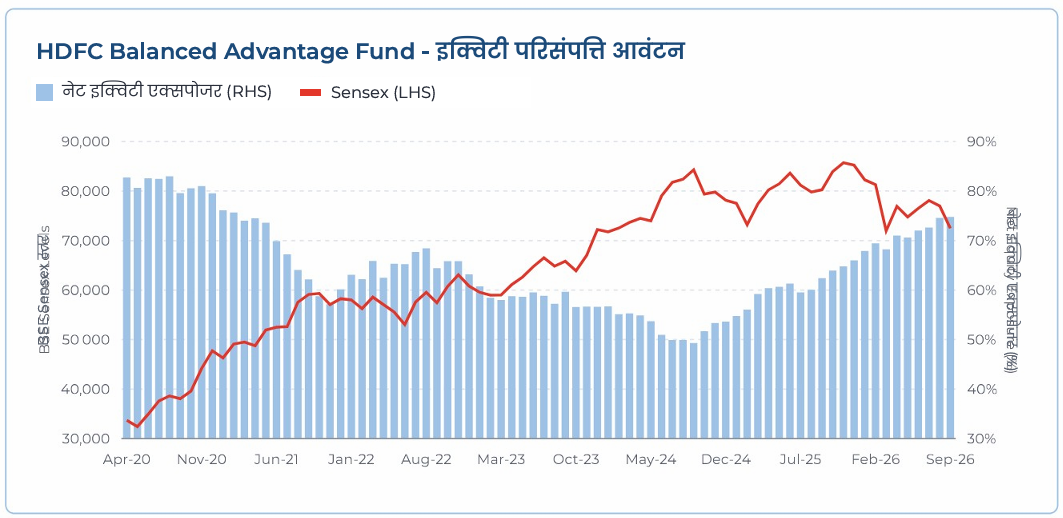
स्कीम के परिसंपत्ति आवंटन की अधिक जानकारी के लिए संबंधित स्कीम सूचना दस्तावेज देखें। नोट: *स्कीम हर समय इक्विटी आवंटन (हेज्ड + अनहेज्ड) कम से कम 65% बनाए रखती है। उपरोक्त ढाँचा मोटे तौर पर संकेतात्मक है और फंड प्रबंधक बाजार की स्थितियों के अनुसार इसमें बदलाव कर सकते हैं। आँकड़े 30 सितंबर 2026 तक के हैं
अस्थिरता के बीच निवेश का एक और अहम पहलू सही मिजाज रखना है। अस्थिरता से निपटने के कुछ सुझाव यहाँ हैं –
बाजार का सही समय पकड़ना आसान नहीं है, और आप बाजार की ताकतों को नियंत्रित नहीं कर सकते। इसलिए अपनी निवेश योजना पर टिके रहना, अपने मिजाज को संभालना और अस्थिर बाजारों में भी लंबे समय तक निवेश बनाए रखने के लिए तैयार रहना जरूरी है। अस्थिरता को अपना दोस्त बनाएँ!
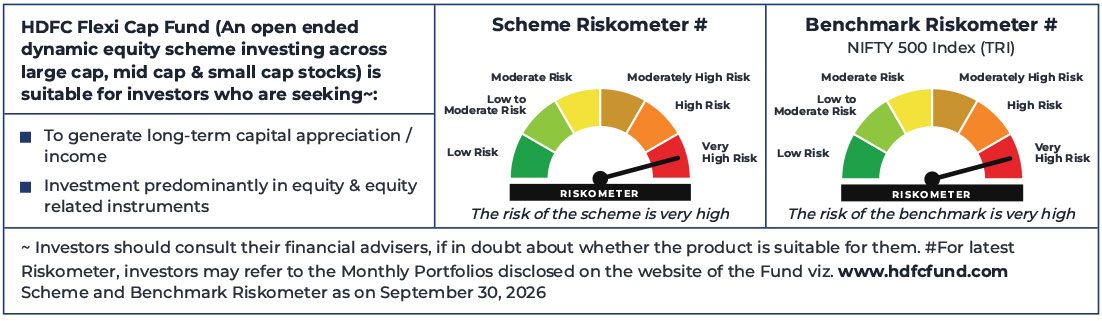
An open ended dynamic equity scheme investing across large cap, mid cap & small cap stocks.
A. SIP प्रदर्शन^ - Regular Plan - Growth Option
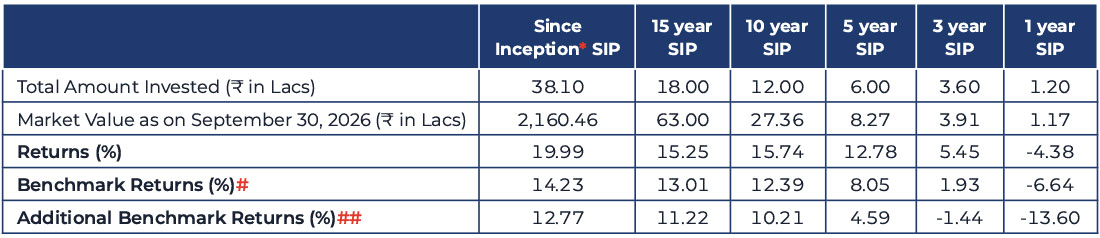
Assuming ₹ 10,000 invested systematically on the first Business Day of every month over a period of time. CAGR returns are computed after accounting for the cash flow by using XIRR method (investment internal rate of return) for Regular Plan - Growth Option. The above investment simulation is for illustrative purposes only and should not be construed as a promise on minimum returns and safeguard of capital. SIP - Systematic Investment Plan.
B. प्रदर्शन^ - Regular Plan - Growth Option
NAV as on September 30, 2026. ₹1,968.685 (per unit)
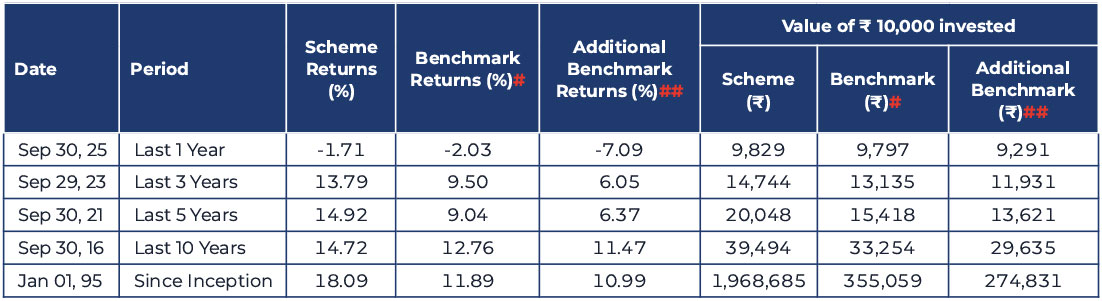
Common notes for the above table A & B: ^Past Performance may or may not be sustained in future and is not a guarantee of any future returns. HDFC AMC / HDFC MF is not guaranteeing or assuring any returns on investments in this Scheme. *Inception Date: January 1, 1995. The scheme is co-managed by Mr. Amit Ganatra (since February 01, 2026) and Mr. Bhagyesh Kagalkar (since August 26, 2026). # NIFTY 500 Index (TRI). ## Nifty 50 Index (TRI). The above returns are of Regular Plan – Growth Option. Returns greater than 1 year period are compounded annualized (CAGR). Load is not taken into consideration for computation of performance. Different Plans viz. Regular Plan and Direct Plan have a different expense structure. The expenses of the Direct Plan under the Scheme will be lower to the extent of the distribution expenses / commission charged in the Regular Plan. As NIFTY 50 TRI data is not available since inception of the scheme, additional benchmark performance is calculated using composite CAGR of NIFTY 50 PRI values from January 1, 1995 to June 29, 1999 and TRI values since June 30, 1999. Above returns are as on September 30, 2026.
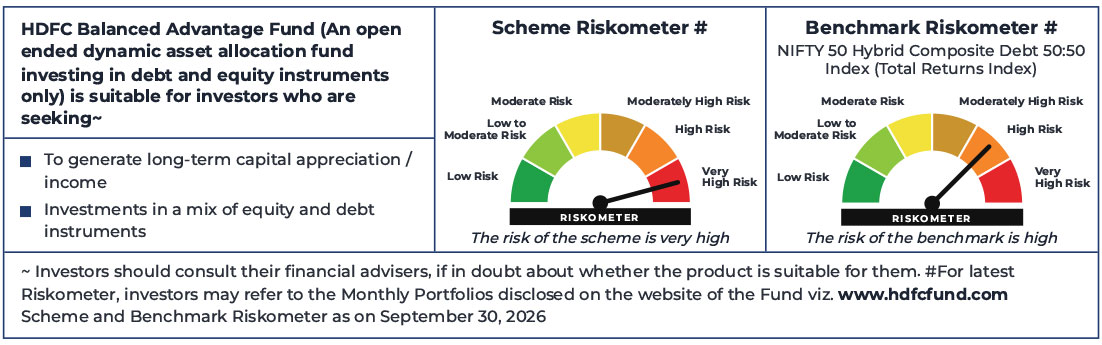
An open ended dynamic asset allocation fund investing in debt and equity instruments only.
A. SIP Performance^- Regular Plan - Growth Option
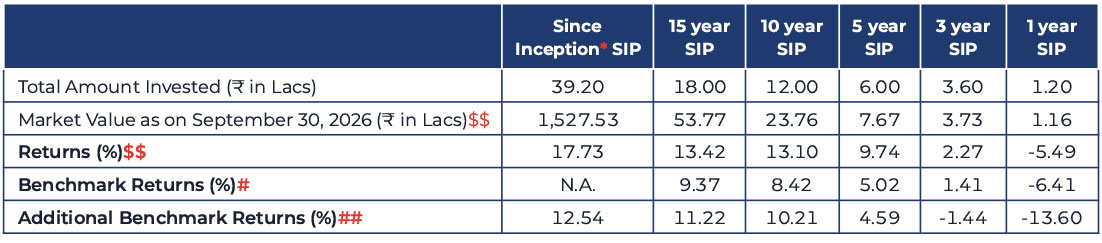
Assuming ₹ 10,000 invested systematically on the first Business Day of every month over a period of time. CAGR returns are computed afteraccounting for the cash flow by using XIRR method (investment internal rate of return) for Regular Plan - Growth Option. The above investmentsimulation is for illustrative purposes only and should not be construed as a promise on minimum returns and safeguard of capital. SIP -Systematic Investment Plan.
B. Performance^- Regular Plan - Growth Option
NAV as on September 30, 2026. ₹505.327 (per unit)
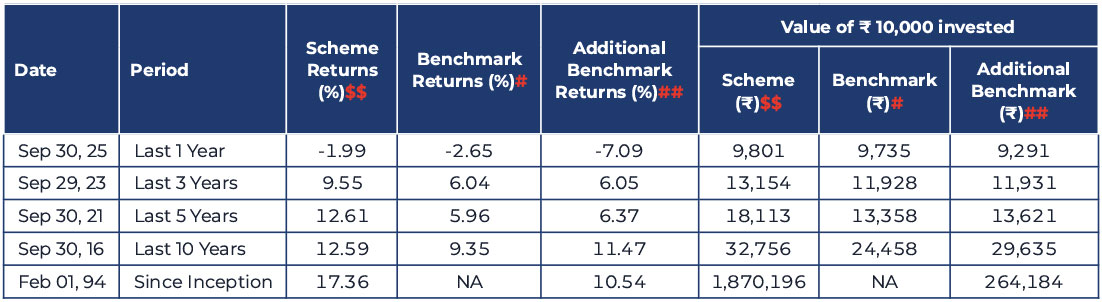
Common notes for the above table A & B: ^Past performance may or may not be sustained in future and is not a guarantee of any future returns. HDFC AMC / HDFC MF is not guaranteeing or assuring any returns on investments in this Scheme. *Inception Date: February 01, 1994. The scheme is co-managed by Mr. Gopal Agrawal (Equity Portfolio) (since July 29, 2022), Mr Ihab Dalwai (Equity Portfolio) (since September 11, 2026),Mr. Arun Agarwal (Arbitrage Assets) (since October 6, 2022), Nandita Menezes (Arbitrage Assets) (since March 29, 2025) and Mr. Anil Bamboli (Debt Portfolio) (since July 29, 2022). # NIFTY 50 Hybrid Composite Debt 50:50 Index (Total Returns Index). ## Nifty 50 Index (TRI). $$ All Distributions declared prior to the splitting of the Scheme into IDCW & Growth Options are assumed to be reinvested in the units of the Scheme at the then prevailing NAV (ex-distribution NAV). As NIFTY 50 TRI data is not available since inception of the scheme, additional benchmark performance is calculated using composite CAGR of NIFTY 50 PRI values from February 1, 1994 to June 29, 1999 and TRI values since June 30, 1999. Scheme performance may not strictly be comparable with that of its Additional Benchmark in view of balanced nature of the scheme where a portion of scheme’s investments are made in debt instruments. Returns greater than 1 year period are compounded annualized (CAGR). Load is not taken into consideration for computation of performance. Different plans viz. Regular Plan and Direct Plan have a different expense structure. The expenses of the Direct Plan under the Scheme will be lower to the extent of the distribution expenses / commission charged in the Regular Plan. Returns as on 30 September, 2026
For performance of other funds managed by fund manager, Please Click here
Note: @@Effective close of business hours of June 1, 2018, HDFC Prudence Fund merged with HDFC Growth Fund (HDFC Balanced Advantage Fund after changes in fundamental attributes). As the portfolio characteristics and the broad investment strategy of HDFC Balanced Advantage Fund is similar to that of erstwhile HDFC Prudence Fund, the track record (i.e. since inception date, dividend history, etc.) and past performance of erstwhile HDFC Prudence Fund has been considered, in line with SEBI circular on Performance disclosure post consolidation/ merger of scheme dated April 12, 2018.
Views expressed above are indicative and should not be construed as investment advice or as a substitute for financial planning. Due to the personal nature of investments, investors are advised to seek professional advice before investing.
MUTUAL FUND INVESTMENTS ARE SUBJECT TO MARKET RISKS, READ ALL SCHEME RELATED DOCUMENTS CAREFULLY.
Stay ahead with our insights
Did you find this interesting?
Your opinion matters - share your thoughts and help us improve.