STP: A Balanced Approach to Mutual Fund Investing
Last Updated On: 15 May 2026


A. SIP Performance - Regular Plan - Growth Option
| Since Inception* | 15 year SIP | 10 year SIP | 5 year SIP | 3 year SIP | 1 year SIP | |
| Total Amount Invested (₹ in lacs) | 21.70 | 18.00 | 12.00 | 6.00 | 3.60 | 1.20 |
| Market Value as on October 31, 2025 (₹ in lacs) | 39.21 | 28.78 | 16.07 | 7.05 | 3.99 | 1.24 |
| Returns (%) | 6.16 | 5.97 | 5.69 | 6.39 | 6.85 | 5.93 |
| Benchmark Returns (%)# | N.A. | 6.00 | 5.83 | 6.89 | 7.48 | 7.12 |
| Additional Benchmark Returns (%)## | 6.35 | 6.37 | 6.09 | 6.38 | 6.92 | 6.00 |
Assuming ₹10,000 invested systematically on the first Business Day of every month over a period of time. CAGR returns are computed after accounting for the cash flow by using XIRR method (investment internal rate of return) for Regular Plan - Growth Option. The above investment simulation is for illustrative purposes only and should not be construed as a promise on minimum returns and safeguard of capital. SIP - Systematic Investment Plan.
B. Performance - Regular Plan - Growth Option
NAV as on October 31, 2025. ₹11.597 (per unit)
| Period | Scheme Returns (%) | Benchmark Returns (%)# | Additional Benchmark Returns (%)## | Value of investment of (₹) 10,000 | ||
| Scheme (₹) | Benchmark (₹)# | Additional Benchmark (₹)## | ||||
| Last 1 Year | 6.38 | 7.74 | 6.65 | 10,638 | 10,774 | 10,665 |
| Last 3 Years | 7.05 | 7.56 | 7.07 | 12,269 | 12,448 | 12,275 |
| Last 5 Years | 5.65 | 6.07 | 5.61 | 13,165 | 13,429 | 13,139 |
| Last 10 Years | 5.61 | 5.52 | 6.20 | 17,272 | 17,128 | 18,260 |
| Since Inception* | 6.51 | NA | 6.27 | 31,171 | NA | 29,948 |
Common notes for the above table A & B: Past performance may or may not be sustained in future and is not a guarantee of any future returns.* Since Inception date:- October 23, 2007. ##NIFTY 50 Arbitrage Index (Total Returns Index) ##CRISIL 1 Year T-Bill Index. The scheme is managed by Mr. Anil Bamboli (Debt Assets) since February 01, 2022, Mr. Arun Agarwal (Arbitrage Assets) since August 24, 2020 and Nandita Menezes (Arbitrage Assets) since March 29, 2025. Returns greater than 1 year period are compounded annualized (CAGR). N.A. Not Available. Scheme performance is not strictly comparable with that of its Additional Benchmark since the scheme does not take directional call in equity markets but is limited to availing arbitrage opportunities, etc. Different plans viz. Regular Plan and Direct Plan have a different expense structure. The expenses of the Direct Plan under the Scheme will be lower to the extent of the distribution expenses / commission charged in the Regular Plan. Load is not taken into consideration for computation of performance. Returns as on October 31, 2025.
For performance of other funds managed by fund manager, Please click here.
| HDFC Arbitrage Fund (An open ended scheme investing in arbitrage opportunities) is suitable for investors who are seeking*: | 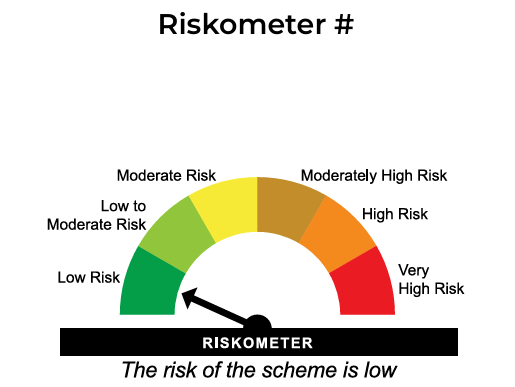 | 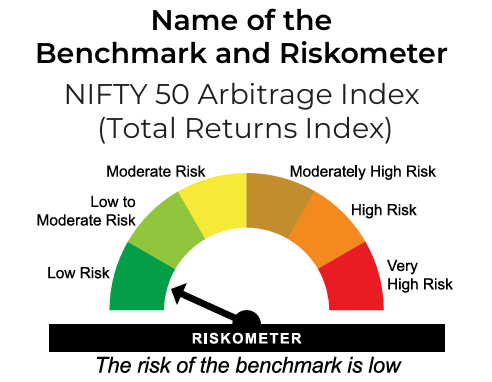 |
| ||
| *Investors should consult their financial advisers, if in doubt about whether the product is suitable for them. #For latest Riskometer, investors may refer to the Monthly Portfolios disclosed on the website of the Fund viz. www.hdfcfund.com Scheme and Benchmark Riskometer as on October 31, 2025. | ||

A. SIP Performance - Regular Plan - Growth Option
| Since Inception* | 15 year SIP | 10 year SIP | 5 year SIP | 3 year SIP | 1 year SIP | |
| Total Amount Invested (₹ in lacs) | 37.00 | 18.00 | 12.00 | 6.00 | 3.60 | 1.20 |
| Market Value as on October 31, 2025 (₹ in lacs) | 2,269.24 | 73.16 | 32.81 | 10.48 | 4.89 | 1.31 |
| Returns (%) | 21.01 | 16.96 | 19.10 | 22.47 | 20.99 | 16.99 |
| Benchmark Returns (%)# | 15.11 | 14.85 | 15.86 | 15.95 | 15.48 | 13.97 |
| Additional Benchmark Returns (%)## | 13.87 | 13.68 | 14.62 | 13.89 | 13.55 | 14.42 |
Assuming ₹10,000 invested systematically on the first Business Day of every month over a period of time. CAGR returns are computed after accounting for the cash flow by using XIRR method (investment internal rate of return) for Regular Plan - Growth Option. The above investment simulation is for illustrative purposes only and should not be construed as a promise on minimum returns and safeguard of capital. SIP - Systematic Investment Plan.
B. Performance - Regular Plan - Growth Option
NAV as on October 31, 2025. ₹2,068.833 (per unit)
| Period | Scheme Returns (%) | Benchmark Returns (%)# | Additional Benchmark Returns (%)## | Value of investment of (₹) 10,000 | ||
| Scheme (₹) | Benchmark (₹)# | Additional Benchmark (₹)## | ||||
| Last 1 Year | 10.20 | 5.56 | 7.59 | 11,020 | 10,556 | 10,759 |
| Last 3 Years | 22.10 | 16.49 | 13.90 | 18,212 | 15,812 | 14,781 |
| Last 5 Years | 29.36 | 21.08 | 18.56 | 36,269 | 26,046 | 23,449 |
| Last 10 Years | 16.44 | 14.64 | 13.67 | 45,893 | 39,248 | 36,060 |
| Since Inception* | 18.87 | 12.50 | 11.77 | 2,068,833 | 378,225 | 309,445 |
Common notes for the above table A & B: Past performance may or may not be sustained in future and is not a guarantee of any future returns.* Since Inception date:- January 1, 1995. #NIFTY 500 Index (TRI) ##Nifty 50 Index (TRI). The scheme is managed by Ms. Roshi Jain since July 29, 2022. Returns greater than 1 year period are compounded annualized (CAGR). As NIFTY 50 TRI data is not available since inception of the scheme, additional benchmark performance is calculated using composite CAGR of NIFTY 50 PRI values from January 1, 1995 to June 29, 1999 and TRI values since June 30, 1999. Different plans viz. Regular Plan and Direct Plan have a different expense structure. The expenses of the Direct Plan under the Scheme will be lower to the extent of the distribution expenses / commission charged in the Regular Plan. Load is not taken into consideration for computation of performance. Returns as on October 31, 2025.
For performance of other funds managed by fund manager, Please click here.
| HDFC Flexi Cap Fund (An open ended dynamic equity scheme investing across large cap, mid cap & small cap stocks.) is suitable for investors who are seeking*: | 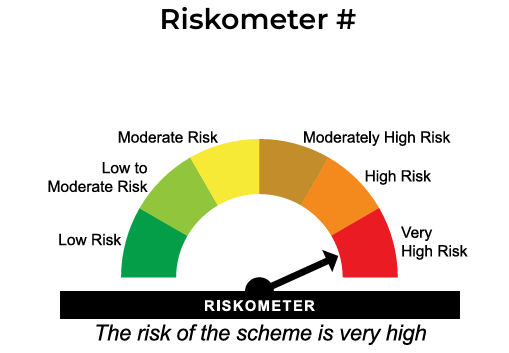 | 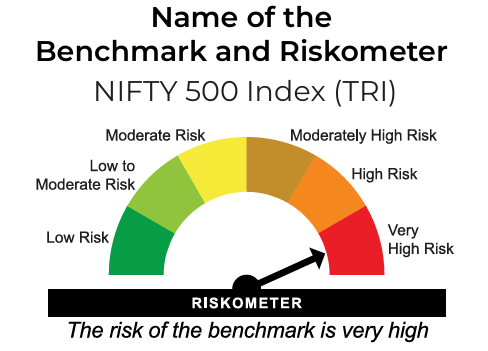 |
| ||
| *Investors should consult their financial advisers, if in doubt about whether the product is suitable for them. #For latest Riskometer, investors may refer to the Monthly Portfolios disclosed on the website of the Fund viz. www.hdfcfund.com Scheme and Benchmark Riskometer as on October 31, 2025. | ||
Views expressed above are indicative and should not be construed as investment advice or as a substitute for financial planning. Due to the personal nature of investments, investors are advised to seek professional advice before investing.
MUTUAL FUND INVESTMENTS ARE SUBJECT TO MARKET RISKS, READ ALL SCHEME RELATED DOCUMENTS CAREFULLY.
Stay ahead with our insights
Did you find this interesting?
Your opinion matters - share your thoughts and help us improve.


