Growing the Investment Pie: How Gen Z Could Build Wealth in a High-Cost World
Last Updated On: 22 Jun 2026


The way paycheque is allocated has evolved noticeably for Gen Z. A larger share of salary is now absorbed by essential expenses, particularly housing and everyday living costs, leaving comparatively less room for savings and long-term investing. At the same time, lifestyle preferences have also shifted. Experiences such as travel, dining out, and social activities have become more integral to how young earners choose to spend, reflecting changing priorities and aspirations.
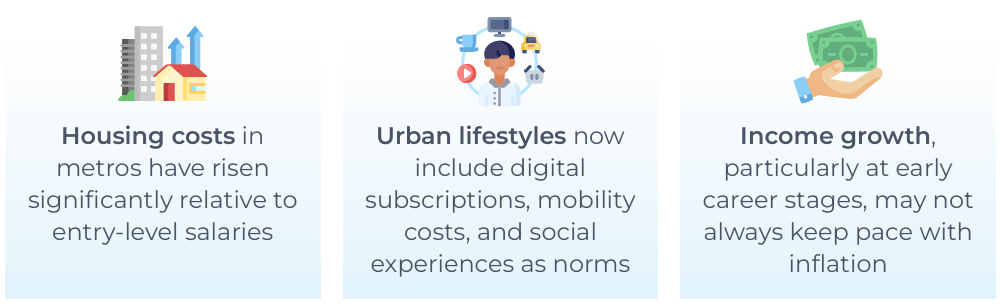
Rather than attributing this to behavioural change alone, it’s useful to consider broader factors:

With a smaller portion of income available for savings, many young earners may face:
Delayed investment participation
Limited emergency buffers
Power of compounding getting impacted over time
This highlights a subtle but important shift: For earlier generation, surplus income enabled investing. Today, investing must be intentionally created.
Small, consistent adjustments could create investable surplus over time.
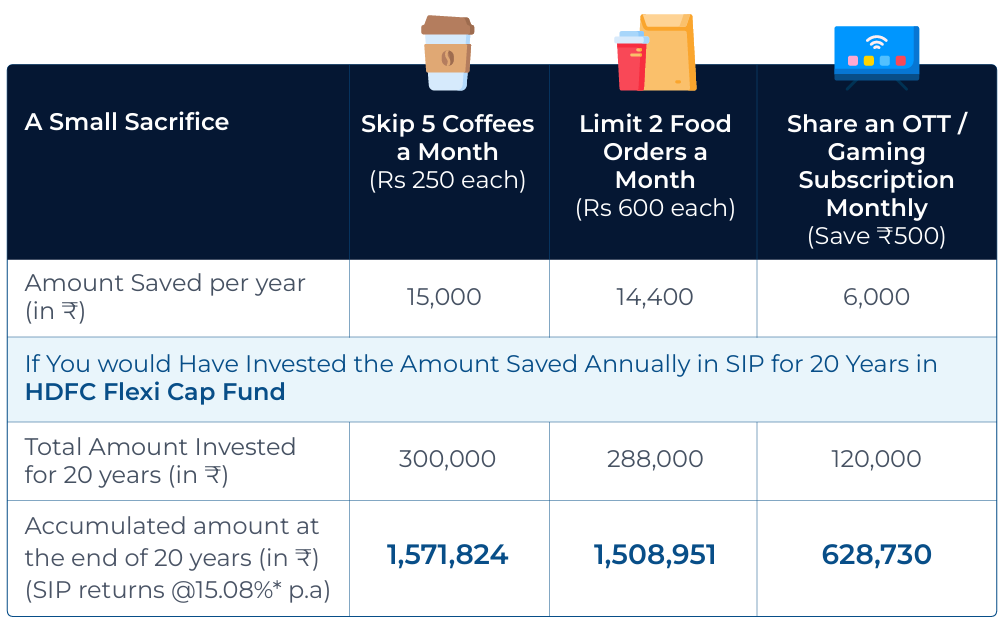
*CAGR returns are computed after accounting for the cash flow by using XIRR method. Actual 20 Years SIP Returns of HDFC Flexi Cap Fund as on 29th May, 2026. The above NAVs are of regular plan - growth option. HDFC Mutual Fund/AMC is not guaranteeing any returns on investments made in this Fund. Past Performance may or may not be sustained in future and is not a guarantee of any future returns.
Earlier generations could often build wealth through larger savings ratios. For Gen Z, the equation is evolving:


complete their term
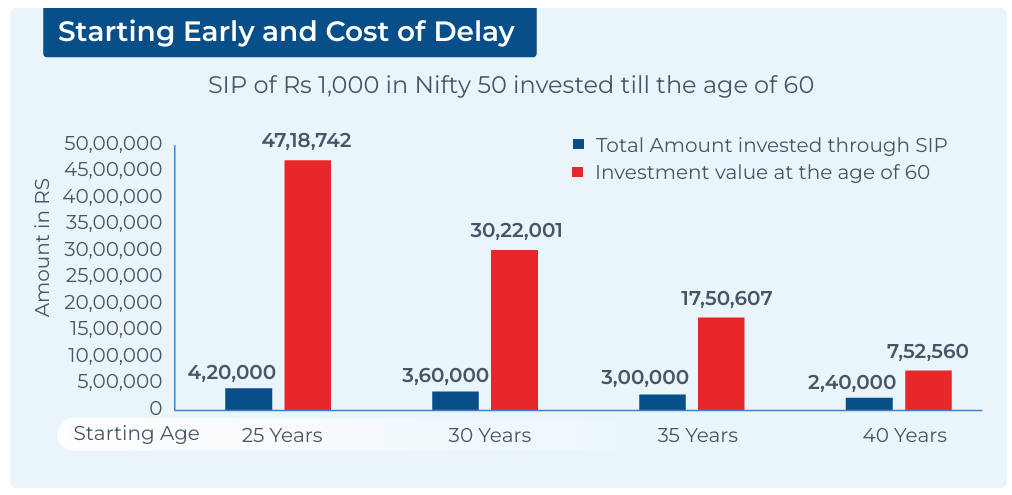
The sooner you start, makes a lot of difference!
Source: MFI 360
Note: CAGR returns are computed after accounting for the cash flow by using XIRR method. Actual SIP Returns of 35 years, 30 years, 25 years, 20 years as on 29th May, 2026. Past performance may or may not be sustained in future and is not a guarantee of any future returns. The above calculations are based on actual returns of NIFTY 50 Index to explain the power of compounding and should not be construed as a promise of minimum returns and safeguard of capital.

Wealth today is increasingly influenced not just by how much you earn, but how consistently you invest over time.
Gen Z’s financial journey is not easier or harder - Just different. Higher living costs have not only reshaped priorities, but also created a need for intentional financial planning.
Even modest, regular investments, enabled by small habit changes could help build long-term wealth.
Start small. Stay consistent. Let time do the heavy lifting!
A. SIP Performance^ - Regular Plan - Growth Option
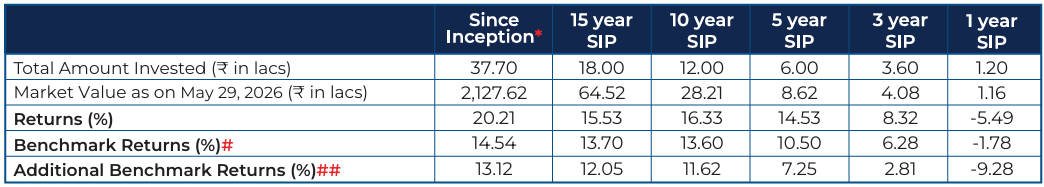
Assuming ₹10,000 invested systematically on the first Business Day of every month over a period of time. CAGR returns are computed after accounting for the cash flow by using XIRR method (investment internal rate of return) for Regular Plan - Growth Option. The above investment simulation is for illustrative purposes only and should not be construed as a promise on minimum returns and safeguard of capital. SIP - Systematic Investment Plan
B. Performance^ - Regular Plan - Growth Option
NAV as at May 29, 2026. ₹1,939.111 (per unit)
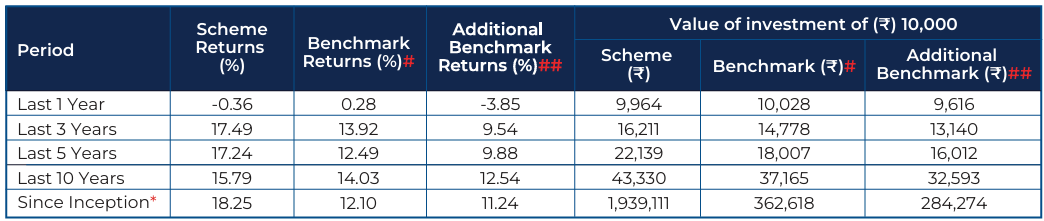
Common notes for the above table A & B: ^Past Performance may or may not be sustained in future and is not a guarantee of any future returns. *Inception Date: January 1, 1995. The scheme is managed by Mr. Amit Ganatra since February 01, 2026. # NIFTY 500 Index (TRI). ## Nifty 50 Index (TRI). The above returns are of Regular Plan – Growth Option. Returns greater than 1 year period are compounded annualized (CAGR). Load is not taken into consideration for computation of performance. Different Plans viz. Regular Plan and Direct Plan have a different expense structure. The expenses of the Direct Plan under the Scheme will be lower to the extent of the distribution expenses / commission charged in the Regular Plan. As NIFTY 50 TRI data is not available since inception of the scheme, additional benchmark performance is calculated using composite CAGR of NIFTY 50 PRI values from January 1, 1995 to June 29, 1999 and TRI values since June 30, 1999. Above returns are as on May 29 , 2026
For performance of other funds managed by fund manager, Please click here.
Views expressed above are indicative and should not be construed as investment advice or as a substitute for financial planning.
Due to the personal nature of investments, investors are advised to seek professional advice before investing.
MUTUAL FUND INVESTMENTS ARE SUBJECT TO MARKET RISKS, READ ALL SCHEME RELATED DOCUMENTS CAREFULLY.
Stay ahead with our insights
Did you find this interesting?
Your opinion matters - share your thoughts and help us improve.


