Weekend Bytes

Pained from short term trades? Welcome to Long Term Investing
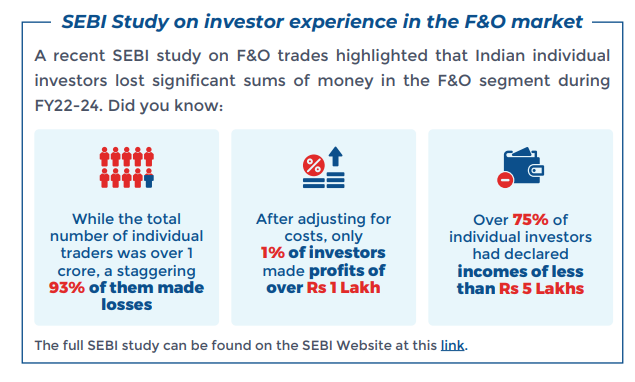
Short-term trades in the equity markets can be incredibly tempting, offering a thrill. However, they often lead to significant losses and net worth erosion, which have been highlighted in studies by SEBI. In this light, we would welcome readers to discover the benefits of long term investing!
But first, let’s see what the SEBI studies had to say:

Welcome to Long Term investing!
We would like to share a study of our own - what long term investors have experienced in India in the long term, and also in FY22-24, the period studied by SEBI.
Out of the 351 equity mutual fund schemes in existence as on 31 March 2021 and 31 August 2024, 99.7% of funds have delivered positive returns (over 31 March 2021 to 31 August 2024), with only 1 fund having a negative return. Simple average annualised return from these 351 funds was 20.8% .
(Source: MFI Explorer)
In the Indian capital market history of over 40 years, It has been witnessed that as time horizons increase, the probability of an investor facing losses in a well-diversified portfolio (such as the one represented by Sensex Index) has tended to be lower. For example, while 31 out of 45 times the 1-year return has been positive (not bad!), the ratio improves significantly as we move towards 3 years (36/43), and 5 years (38/41). In fact, in 10 year periods, there is just one instance of negative return, and none in 15 and 20 year periods so far.

Returns history over different time periods

Source: HDFC MF Handbook, MFI Explorer. Past performance may or may not be sustained in future and is not a guarantee of any future returns. The above is just an illustration. SENSEX returns are computed for 1 ,3, 5, 10, 15 & 20 years from the date of investment. Source: BSE Ltd, Returns for 1 year are absolute and above 1 year CAGR. CAGR – Compounded Annual Growth Rate: The rate at which an investment grows annually over a specified period of time. Column 2: shows the value of BSE SENSEX at the end of month of the respective period. Probability of gains is the number of times the investor would have made positive returns. Column 3 to 8: Represents the return earned on the investment for the referred period. For e.g. If you invested in Mar-79 when SENSEX Index was 100, then 1 year returns (in Mar-80) would have been 29%, 3 years returns (in Mar-82) would have been 30%, 5 years returns (in Mar-84) would have been 20%, 10 year returns (in Mar-89) would have been 22%, 15 year returns (in Mar-94) would have been 27%, and 20 year returns (in Mar-99) would have been 20%.
In conclusion
While 9 out of 10 investors made losses in the F&O segment, 7 out of 10 investors made losses in the intraday trade segment. In comparison, long term investing in Mutual Funds where chances of long term losses have been low (as seen in the experience of Mutual fund schemes and Sensex returns above), appears to be a better option.
Ideas such as benefits of long-term investing, diversification, asset allocation are very important for investors to understand. At HDFC MF, we have highlighted these in our series of Weekend Bytes written over the years. We also invite readers to refer our HDFC MF Handbook, which has multiple such ideas explained with easy examples.
MUTUAL FUND INVESTMENTS ARE SUBJECT TO MARKET RISKS, READ ALL SCHEME RELATED DOCUMENTS CAREFULLY.